Popular stock screens
Tap to openHow the screens are picked, and what the tags mean
Most screeners hand you a list and leave you to guess whether it ever worked. Here each ready-made screen carries a tag from our own tests on NSE data (2014 → 2026). Every stock was compared with the average stock bought on the same day, so a rising market doesn't flatter the result.
- ✅ Tested did better than the average stock in most years.
- ⚠️ Warning did worse than the average stock in most years, so be careful buying these.
- ➖ Mixed worked in some years and failed in others.
- No tag: not tested yet. It's a plain filter.
Past results, not advice. Tests ignore brokerage and tax, and a screen that worked for 12 years can still stop working. We re-test the screens as new data comes in and update the tags.
Why use this stock screener?
The problem with most stock screeners
India has great screeners. Screener.in lets you query 10 years of company financials, and Tickertape and Trendlyne offer hundreds of filters. But a filter only tells you which stocks match a rule, not whether that rule ever made money. "Near 52-week high", "golden crossover" and "FII buying" all sound good. Before you put money behind one, you'd want to know how stocks like that did next. Most screeners leave that test to you. Here, each of the 16 ready-made screens is either tested and tagged, or clearly marked "not tested yet".
How it works: NSE data, rebuilt every trading day
Prices, volume and delivery come from the NSE daily bhavcopy. Quarterly results and shareholding come from the XBRL filings companies send to NSE corporate filings, and mutual fund holdings from AMC monthly portfolios published under AMFI rules. Every trading day we turn this into one file covering about 2,624 stocks. Your browser then does all the filtering, so the screener is fast even on a phone. Large, mid and small cap follow AMFI's half-yearly cap list, and index tags (Nifty 50, Midcap 150, Smallcap 250) follow NSE Indices.
Delivery: the number most screeners skip
Volume tells you how much was traded. Delivery percentage tells you how much of it was real buying, with shares going into demat accounts instead of being sold the same day. That difference showed up again and again in our tests. A breakout with delivery 1.3× or more of normal beat the average stock in 12 of 14 years, though only by a small margin. Heavy trading by mostly day traders in a weak business lagged in 7 of 7 years. That's why the Momentum view shows trading and delivery "vs usual", not just raw volume.
P/E against the stock's own past, not the market
A P/E of 40 is cheap for some companies and expensive for others. So each stock's P/E is compared with the median of its own month-end P/E over the last 5 years. "Lower than usual" means today's P/E is in the bottom quarter of that range. Growth is measured on the last 4 quarters against the 4 before, on the same consolidated or standalone basis, so one odd quarter doesn't make a company look like a star. Debt shows as "None" or "Almost none" when a company barely borrows.
What you can do with it
Screen all ~2,600 NSE stocks or one size group, filter by sector, P/E, profit growth, ROE, debt and liquidity, and sort by momentum, breakouts or market cap. See which stocks promoters, FIIs and mutual funds have been adding to, and spot high promoter pledges. Find growing companies with results due this week. Open any stock in the SIP Backtester for its full history. For general investor education, SEBI's investor website is a good, neutral starting point.
What our tests found (NSE, 2014 → 2026)
Each result compares the stocks a screen picked with the average stock bought on the same day.
Do breakouts with real buying keep going?
Fresh 6-month-high breakouts with delivery 1.3×+ of normal beat the average stock over the next 3 months in 12 of 14 years (2013–2026, 12,118 cases), by about 0.9 points. A small edge: only 45 in 100 single picks beat it. Over 1 month: no edge. Past result, not a forecast.
What happens if you buy a stock in a falling trend?
Small caps below a falling 200-day average and in the bottom fifth by 6-month return lagged the average stock over 3 months. They were ahead in only 2 of 12 years.
Is a sharp bounce in a downtrend worth buying?
A 10%+ one-month bounce inside a downtrend lagged the average stock by about 1.2% the next month. It came out ahead in just 1 of 12 years. Most such bounces failed.
Does buying stocks near their high still work?
For years, the top fifth of stocks near their 52-week high beat the bottom fifth by almost 10 points over 3 months. In 2025 and 2026 it flipped, so the screen is tagged Mixed.
Approximate results from historical NSE data, before brokerage and tax. Past performance does not guarantee future results.
Stock screener questions
What is a stock screener, and how does this one work?
A stock screener filters the whole market down to the stocks that match some rules, so you don't have to check 2,600 charts and result sheets by hand. This free stock screener for India covers about 2,600 NSE stocks. Pick a ready-made screen (momentum, fresh breakouts, heavy trading, growth, value or who is buying), then narrow it by size, sector, P/E, growth, ROE or debt. Click any stock to open its card with price, momentum, business numbers and shareholding.
Is this stock screener free? Do I need to sign up?
It's free, and there is nothing to pay. All untagged screens, the Overview and Momentum views, every filter and the price & momentum part of each stock card work without an account. The tested screens (our own research), the Business and Owners views and the full stock card need a free Google sign-in that takes about 5 seconds. We use it to keep the data costs in check, not to sell anything.
Where does the data come from?
Prices, volume and delivery come from NSE's daily bhavcopy. Quarterly results and shareholding come from the XBRL filings companies send to NSE. Mutual fund holdings come from AMC monthly portfolio files. Splits and bonuses are adjusted, so returns and P/E are not thrown off by a share split.
How often is the screener updated?
Every trading day. The data file is rebuilt twice a day, in the morning and in the evening, after NSE publishes the day's bhavcopy. Prices are end-of-day closing prices, not live quotes, and the exact date is shown at the top of the screener. Results and shareholding update as companies file them, and fund holdings update once a month.
What do the Tested, Warning and Mixed tags mean?
Each tag comes from our own tests on NSE data from 2014 to 2026. Every stock a screen would have picked was compared with the average stock bought on the same day, so a rising market doesn't flatter the result. ✅ Tested means it did better than the average stock in most years. ⚠️ Warning means it did worse in most years. ➖ Mixed means it worked in some years and failed in others. No tag means it is a plain filter we haven't tested yet.
Do breakout stocks keep rising? What 12 years of NSE data shows
It depends on who is buying, and the edge is small. In our tests on 12,118 past breakouts (2013 to November 2026), a fresh breakout (a new 6-month high after a 10%+ dip) where delivery on the breakout days was 1.3× or more of normal did about 0.9 points better than the average stock bought the same day over the next 3 months, and came out ahead in 12 of 14 years. Single stocks vary a lot: only 45 in 100 beat the average stock, and a few big winners pull the average up. A wallet holding 10 of these at a time did about the same as random stocks and less than the Nifty. Over just 1 month there was no edge. Past result, not a forecast. That is the "Fresh breakout + real buying" screen.
What happens if you buy a stock in a falling trend?
Usually it keeps falling. Stocks below a falling 200-day average and in the bottom 20% by 6-month return did worse than the average stock over the next 3 months: small caps by about 2.0 points, and they were ahead in only 2 of 12 years. A sharp 10%+ bounce inside such a downtrend did no better. It lagged by about 1.2% the next month and was ahead in only 1 of 12 years.
What is delivery percentage, and why does it matter?
Delivery is the share of traded shares that buyers actually took into their demat accounts instead of selling the same day. Heavy trading with high delivery usually means real buying. Heavy trading with low delivery usually means day traders. In our tests, heavy trading on its own told us nothing. Weak businesses rising on low delivery did worse than the average stock the next month in 7 of 7 years.
How is P/E worked out, and what does "lower than its usual" mean?
P/E is the latest closing price ÷ the last 4 quarters' earnings per share, adjusted for splits and bonuses. "Usual" is the median of the stock's own month-end P/E over the last 5 years, so a bank is compared with itself, not with an IT company. "Lower than usual" means today's P/E is in the bottom quarter of its own 5-year range. A loss-making company has no P/E.
What do "Growing", "Steady" and "Weak" mean?
They compare the last 4 quarters' profit with the 4 quarters before that, on the same basis (consolidated or standalone). Growing means profit is up 10% or more. Weak means profit is lower than a year ago, or the company made a loss. Steady is anything in between. Using 4 quarters instead of one smooths out seasonal businesses and one-off quarters.
How do I find debt-free stocks with high ROE?
Pick the "Debt-free + high ROE" screen. It keeps companies whose borrowings are under 10% of their own money (equity) and whose return on equity is 20% or more, leaving out banks. In the Business view, "Debt / own money" shows "None" when a company has no borrowings at all and "Almost none" when the ratio is under 0.01. You can also add a debt filter to any other screen from "More filters".
How can I see which stocks promoters, FIIs or mutual funds are buying?
Use the "Who is buying" screens. Promoters buying = promoter holding up 1 point or more vs a year ago with under 5% pledged. FIIs buying = foreign holding up 2 points or more. Mutual funds buying = fund holding up 1.5 points or more. The Owners view and the "Who owns it" part of each stock card show promoter, FII, DII and mutual fund stakes, their 1-year change and pledges.
How is this different from Screener.in, Tickertape or Chartink?
Those are excellent tools with far more filters, and you can write your own queries on them. This screener is smaller on purpose. It has fewer, ready-made screens, and each one tells you how stocks like these did in past years against the average stock. It also uses NSE delivery data, so it can tell real buying from day-trader churn, and it compares P/E with each stock's own history.
Why are some stocks missing numbers?
About 400 small or newly listed companies have no quarterly results in our data yet, so they show price and trading numbers only. Banks show bad loans (NPA) and return on assets instead of margin and debt, because borrowing is their raw material.
Is this investment advice?
No. The screener shows data and the results of past tests, which ignore brokerage and tax. A screen that worked for 12 years can still stop working, and every company needs its own homework before you buy. For help choosing investments, talk to a SEBI-registered investment adviser.
How to use the Stock Screener
Three steps, under a minute.
Pick a ready-made screen
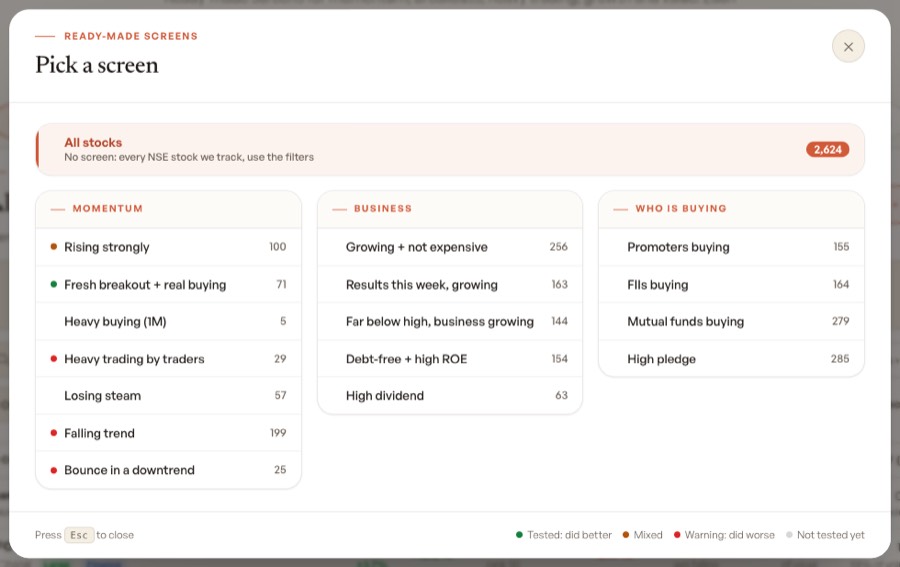
Tap "Change screen". Screens are grouped into Momentum, Business and Who is buying, with today's stock count next to each. A green dot means tested and did better, red means a warning.
Read the results and narrow them
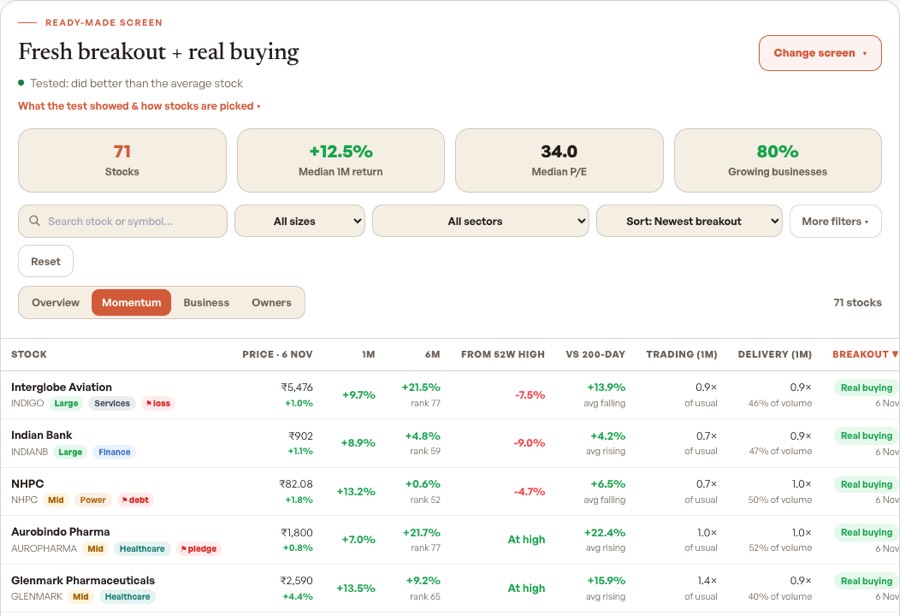
The tiles show how many stocks match, their median return and P/E. Filter by size, sector or "More filters", and switch between the Overview, Momentum, Business and Owners views.
Open a stock card
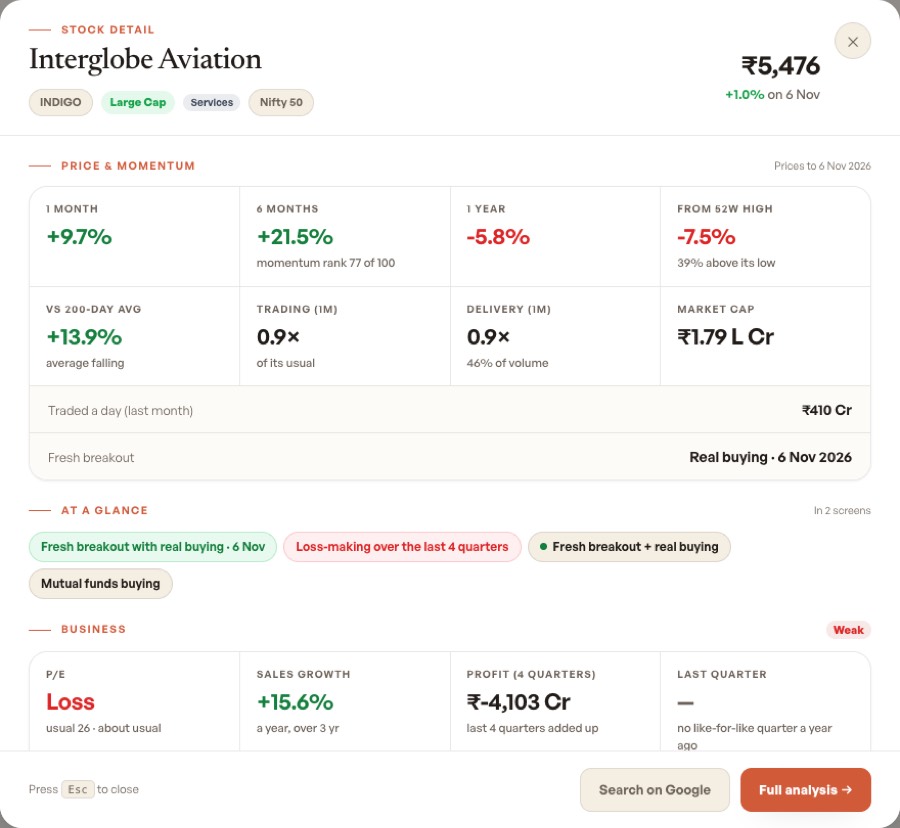
Click any stock for its card: price and momentum, flags at a glance, business numbers and who owns it. "Full analysis" opens the stock in the SIP Backtester for its full history.

Built by
Kuldeep Singh
Personal Finance Writer & Developer
Kuldeep builds free, data-driven tools for Indian investors using official NSE, BSE and AMFI data, with no paywalls. The screens here come from his own tests on 12 years of NSE prices, delivery and company filings, re-run as new data comes in.