Popular Searches
Click to filter instantly
Why This Screener Is Different
Most screeners have a built-in conflict of interest
Groww, ET Money, Tickertape, and Moneycontrol all earn commissions when you transact through them — so their default sorts, "recommended" tags, and highlighted metrics subtly favour funds that pay higher distributor commissions. PrimeInvestor's screener is accurate but paywalled. Tickertape gates its deeper TER filters behind Tickertape Pro. None of them lead with the commission gap as the headline metric — the single number that tells you how much of your money goes to a distributor every year. This screener does exactly that, for all 2,000+ AMFI schemes, free.
100% official AMFI data — no editorial opinion, no hidden scoring
Expense ratio data is downloaded directly from AMFI's official monthly BER disclosure API — the same source all AMCs are legally required to file with under SEBI regulations. NAV and return data comes from AMFI's NAVAll.txt. No star ratings influenced by advertising. No proprietary adjustments. What you see is what AMCs reported to the regulator.
How does the commission gap actually work? What ₹10 lakh looks like
The commission gap is the percentage your distributor earns from your investment every year. On ₹10 lakh with a 1% commission gap, ₹10,000/year goes to your broker — not your returns. Over 15 years of SIP at ₹10,000/month with 12% market growth, that 1% gap compounds into approximately ₹35–40 lakh less in your final corpus vs a Direct plan. High-commission categories: ELSS (gap often 0.80%–1.40%), Sectoral/Thematic funds (0.60%–1.20%), Mid and Small Cap (0.70%–1.10%). Low-gap categories: Liquid funds (0.05%–0.20%), Overnight (near zero), Gilt (0.10%–0.40%).
Is SEBI's 2026 BER rename just cosmetic, or does it change anything?
In December 2025, SEBI notified the Mutual Funds Regulations, 2026, renaming Total Expense Ratio (TER) to Base Expense Ratio (BER). The practical changes: BER now excludes GST, stamp duty, and SEBI fees — those are charged separately on top. More importantly, the expense ratio cap for ETFs and index funds dropped from 1.00% to 0.90%, which is meaningful for large passive funds. The data in this screener reflects the new BER figures directly from AMFI's monthly filing. For most investors comparing costs between funds, the numbers work identically to before — just renamed and slightly more transparent in breakdown.
Why do the cheapest ETFs cost 0.04% while Regular mutual funds can cost over 2%?
ETFs are passively managed — they track an index mechanically with minimal human intervention, so management costs are near-zero. They also have no distributor commission layer since they are traded on the exchange like shares. Active equity funds pay portfolio managers, analysts, and research teams, plus distributor trail commissions in Regular plans. A Regular Large Cap fund at 1.8% vs a Nifty 50 ETF at 0.07% means you pay 1.73% more per year for the active fund's management and distribution — which over 20 years, with compounding, erodes a substantial portion of your wealth. This screener lets you compare all of them side by side.
Mutual Fund Distributor Commission — What They Actually Earn From You
Trail commission is the annual fee your distributor earns as long as your money stays in a Regular plan. SEBI banned upfront commission in 2018 — all distributor income is now trail-only, paid by the AMC from the fund's expense ratio. Below are typical trail commission ranges by fund category, derived from AMFI's monthly BER disclosures.
| Fund Category | Trail Commission Range | On ₹10 lakh/yr |
|---|---|---|
| Small Cap / Mid Cap Equity | 0.80% – 1.40% | ₹8,000 – ₹14,000 |
| ELSS / Tax Saver | 0.60% – 1.20% | ₹6,000 – ₹12,000 |
| Flexi Cap / Large & Mid Cap | 0.60% – 1.00% | ₹6,000 – ₹10,000 |
| Large Cap / Bluechip | 0.50% – 0.90% | ₹5,000 – ₹9,000 |
| Hybrid / Balanced Advantage | 0.50% – 1.00% | ₹5,000 – ₹10,000 |
| Index Funds (Regular) | 0.10% – 0.40% | ₹1,000 – ₹4,000 |
| Debt / Long Duration | 0.20% – 0.60% | ₹2,000 – ₹6,000 |
| Liquid / Overnight | 0.05% – 0.20% | ₹500 – ₹2,000 |
How does trail commission actually work?
The AMC pays the distributor's commission from the Regular plan's expense ratio — you never write a cheque to your broker. Instead, the Regular plan's NAV grows slightly slower than the Direct plan's NAV by exactly the commission gap. Over 10 years on ₹5 lakh invested in a mid-cap fund with a 1.0% gap: the Regular plan user ends up with approximately ₹1.6–2.0 lakh less than the Direct plan user — that sum went to the distributor. Use the Direct vs Regular Calculator to calculate the exact rupee cost for your specific investment and horizon.
Commission ranges are approximate, derived from AMFI's monthly BER disclosures. Actual commission varies by AMC, scheme AUM slab, and specific fund. Source: AMFI BER disclosures.
What the Data Actually Shows
Approximate figures from current AMFI data. Past performance does not guarantee future results.
Cheapest category
Nifty 50 ETFs — from 0.04%/yr
Multiple AMCs offer Nifty 50 ETFs at 0.04%–0.12%. Even a 0.50% index fund charges 4–12× more. On ₹1 crore, that 0.40% difference is ₹40,000/year compounding in your favour — not the fund's.
Highest commission gap
ELSS — gap often 0.80%–1.40%
ELSS (tax-saving) funds tend to have the largest commission gap. On a ₹1.5 lakh 80C investment with a 1.2% gap, ₹1,800/year goes to your distributor — and compounds against you over the 3-year lock-in and beyond.
Gold & Silver ETFs
Gold ETFs: ~0.40%–0.65% expense ratio
Gold ETFs returned approximately 20–30% in FY 2024-25, with Silver ETFs even higher. At 0.40%–0.65% expense ratio, they are significantly cheaper than physical gold storage charges and gold savings schemes. No demat? Use a Gold ETF FoF — slightly higher cost but no exchange access needed.
Fund of Funds
FoF: 0.40%–1.80% all-in (stacked cost)
International FoFs often show 0.80%–1.50% combined expense ratio — the wrapper fee plus the underlying overseas ETF's cost, as mandated to be disclosed by SEBI since 2018. Visible in this screener without any calculation required.
Typical Mutual Fund Expense Ratios in India (2026)
Reference data from AMFI filings. Actual figures vary by AMC and scheme — use the screener above for exact values.
| Category | Direct TER | Regular TER | Commission Gap |
|---|---|---|---|
| Nifty 50 ETF | 0.04%–0.12% | N/A (exchange-traded) | — |
| Index Fund (Nifty 50) | 0.10%–0.30% | 0.50%–0.90% | 0.30%–0.70% |
| Large Cap Fund | 0.30%–0.80% | 1.20%–1.80% | 0.60%–1.20% |
| Mid Cap Fund | 0.40%–0.85% | 1.30%–1.90% | 0.70%–1.10% |
| ELSS (Tax Saver 80C) | 0.35%–0.80% | 1.20%–2.00% | 0.80%–1.40% |
| Sectoral / Thematic | 0.40%–0.90% | 1.40%–2.25% | 0.60%–1.20% |
| Gold ETF | 0.40%–0.65% | N/A (exchange-traded) | — |
| Liquid / Overnight Fund | 0.10%–0.25% | 0.15%–0.40% | 0.05%–0.20% |
| International FoF | 0.50%–1.00% | 0.80%–1.50% | 0.20%–0.60% |
Source: AMFI monthly BER disclosures, 2026. Ranges show typical values across AMCs — actual figures vary. Use the screener above for exact current data.
Is Your Expense Ratio Good? — Category Benchmarks for 2026
What counts as a "good" expense ratio depends entirely on the fund type. An ETF at 0.75% is expensive; an active mid-cap fund at 0.75% is cheap. Use this table to benchmark any fund — then check the actual figure in the screener above.
| Fund Type | Good (Direct) | Acceptable | Too High |
|---|---|---|---|
| Nifty 50 / Sensex ETF | Under 0.10% | 0.10%–0.20% | Over 0.30% |
| Index Fund (Nifty 50 / Next 50) | Under 0.20% | 0.20%–0.40% | Over 0.50% |
| Large Cap Active (Direct) | Under 0.65% | 0.65%–0.90% | Over 1.00% |
| Flexi Cap / Mid Cap (Direct) | Under 0.75% | 0.75%–1.00% | Over 1.20% |
| Small Cap Active (Direct) | Under 0.85% | 0.85%–1.10% | Over 1.30% |
| ELSS / Tax Saver (Direct) | Under 0.60% | 0.60%–0.90% | Over 1.10% |
| Gold ETF | Under 0.45% | 0.45%–0.65% | Over 0.70% |
| Liquid / Overnight Fund (Direct) | Under 0.15% | 0.15%–0.25% | Over 0.30% |
Is 0.75% expense ratio too high? What about 1.5% or 1.8%?
For an active flexi-cap or mid-cap Direct plan, 0.75% is acceptable — not great, but not alarming. For a large-cap fund, 0.75% is slightly high; check if a cheaper alternative exists in the same category. For any index fund or ETF, 0.75% is far too high — you can get the same Nifty 50 exposure for 0.04%–0.12%. For a Regular plan, anything above 1.5% means your distributor is earning close to 1% annually — a significant drag. Sort by 'Commission Gap — Highest first' in the screener to identify which of your funds has the highest distributor cost.
SEBI expense ratio caps in India (2026)
Under SEBI's Mutual Funds Regulations, 2026, the maximum Base Expense Ratio (BER) for equity funds is 2.25% for schemes with AUM above ₹50,000 crore, scaling to higher caps for smaller AUM. For ETFs and index funds, the BER cap was reduced from 1.00% to 0.90%. If a fund's expense ratio is near the SEBI cap, it is almost certainly a Regular plan — no well-run Direct plan comes close to these ceilings.
Expense Ratio, answered
How do I compare mutual fund expense ratios in India?
To compare mutual fund expense ratios in India: (1) Use this free screener — it shows Direct TER, Regular TER, and the Commission Gap for all 2,000+ AMFI-registered funds side by side. (2) Switch to the Mutual Funds tab and sort by "Direct TER — Lowest first" to find cheapest funds in any category. (3) Use the Category filter to compare only within Large Cap, ELSS, Liquid, or any other category. (4) Click any column header to re-sort. All data is sourced directly from AMFI's official monthly BER disclosures — the same data your AMC is legally required to file with SEBI.
What is a good expense ratio for a mutual fund in India?
A good expense ratio depends on the fund type. For ETFs and Nifty 50 index funds, anything under 0.15% is excellent — the cheapest Nifty 50 ETFs charge just 0.04%/year. For active equity Direct plans (Large Cap, Flexi Cap), under 0.70% is competitive. For ELSS Direct plans, under 0.60% is good. For liquid and overnight funds, under 0.15% Direct TER is the benchmark. As a general rule: always compare the Direct plan, not Regular — Regular plans add 0.5%–1.4% for distributor commissions that do not improve your returns. Use the reference table above and this screener's sort-by-TER feature to find the cheapest option in your chosen category.
What is TER (expense ratio) in mutual funds and why does it matter?
TER (now called Base Expense Ratio or BER under SEBI's 2026 regulations) is the annual fee deducted silently from your NAV every single day — whether markets go up or down. A 1.5% expense ratio on ₹1 lakh = ₹1,500/year gone automatically. Over 20 years, a 1% expense ratio difference compounds into losing 18–22% of your total corpus. SEBI caps equity fund expense ratios at 2.25% and ETF/index fund expense ratios at 0.90% (lowered from 1.00% in 2026).
What is the difference between Direct and Regular plan expense ratio?
Direct plans have no distributor — you invest through the AMC or a SEBI-registered fee-only advisor. Regular plans route through a bank, broker, or app that earns trail commission from your money every year. Both plans hold identical underlying securities; the only difference is cost. Direct TER is typically 0.5%–1.5% lower than Regular. The Comm. Gap column in this screener shows the exact percentage your broker earns from your investment annually.
What is the "commission gap" and how much does it cost over time?
The commission gap = Regular TER minus Direct TER — the percentage that goes to your distributor each year. On ₹10 lakh with a 1% commission gap, ₹10,000/year goes to your broker, not your returns. Over 15 years of SIP at ₹10,000/month with 12% market growth, that 1% gap compounds to approximately ₹35–40 lakh less in your final corpus versus a Direct plan. Sort this screener by "Commission Gap — Highest first" to see which funds pay distributors the most from your money.
Why do ETFs show only one expense ratio instead of Direct vs Regular?
ETFs are traded on stock exchanges like shares — anyone with a demat account buys and sells at market price. There is no Direct or Regular plan concept for ETFs. The single expense ratio covers the AMC's management cost only, with no distributor commission layer. That is why ETFs are typically the cheapest investment vehicle in India — many Nifty 50 ETFs charge as little as 0.04%/year. Under SEBI's 2026 regulations, the expense ratio cap for ETFs and index funds was lowered from 1.00% to 0.90%.
What changed with SEBI's 2026 Base Expense Ratio (BER) regulation?
In December 2025, SEBI notified the Mutual Funds Regulations, 2026, renaming Total Expense Ratio (TER) to Base Expense Ratio (BER). BER now excludes GST, stamp duty, and SEBI regulatory fees — those are charged separately. More importantly, the expense ratio cap for ETFs and index funds dropped from 1.00% to 0.90%. This screener reflects the latest BER data from AMFI's monthly filings. For most investors comparing costs between funds, the numbers work identically to before — just renamed and more transparent in their breakdown.
Which are the cheapest ETFs in India by expense ratio?
Nifty 50 ETFs are typically the cheapest at 0.04%–0.12%/year. Bharat Bond ETFs charge 0.0005%–0.04% depending on series. Gold ETFs range 0.40%–0.65%. Silver ETFs typically charge 0.40%–0.50%. Use the ETF tab in this screener, set Category to filter by type, and sort by Expense Ratio — Lowest first to see current cheapest options. Data is sourced from AMFI's official monthly BER disclosures — no editorial scoring.
How does the Fund of Funds (FoF) double expense ratio work?
A FoF charges its own expense ratio on top of the underlying fund's expense ratio. Since 2018, SEBI mandates that the consolidated all-in expense ratio for FoFs is disclosed in AMFI filings — so the figure in this screener for any FoF already includes the underlying cost. An international FoF investing in an overseas ETF (charging 0.20%–0.50%) and adding its own 0.40%–0.80% wrapper will show a combined 0.80%–1.50% in the data. No calculation required — just read the column.
Gold ETF vs Gold ETF Fund of Fund — which is actually cheaper?
In most cases, a Gold ETF is cheaper — FoFs add a wrapper cost on top of the ETF's expense ratio. The key practical difference: a Gold ETF requires a demat account and trades during market hours; a Gold ETF FoF works like a regular mutual fund with no demat needed. Search "gold" in the ETF tab of this screener to compare all Gold ETF expense ratios side by side from AMFI's official data.
Where does the data come from? Is it official?
All data is sourced exclusively from AMFI's official monthly BER disclosure, mandated by SEBI. NAV and return data comes from AMFI's NAVAll.txt and historical NAV reports — the same source AMCs and regulators use. No third-party, editorial, or proprietary data is used.
How often is the data updated?
AMFI publishes expense ratio data on a rolling daily basis, with full monthly filings. This screener processes the latest complete month's data at the start of each month — averaging daily entries within the month for stability (avoids one anomalous day skewing the figure). The "Last updated" date shown in the beta notice reflects the actual data refresh. Return figures use a 5-day lookback window to handle NAV gaps common in overseas FoFs.
Why should I choose a Direct plan over a Regular plan?
Every rupee of the commission gap goes to your distributor, not your returns. If your bank's mutual fund app shows Regular plans, your bank earns trail commission from your investment — typically 0.5%–1.0%/year. On a ₹5 lakh portfolio, that is ₹2,500–5,000 annually going to the distributor. Direct plans are available through AMC websites, MFCentral, CAMS, KFintech, and SEBI-registered fee-only advisors. The Comm. Gap column here shows exactly which funds your distributor profits most from recommending.
Is this tool free? Do I need to sign up?
Completely free, no account, no email, no login required — ever. Data is downloaded from AMFI's public API and served as a static file with no tracking beyond standard site analytics and ads. Built to give Indian investors unbiased, official data without any commercial incentive from fund transactions.
Can I use this to find the cheapest debt or liquid funds?
Yes. Mutual Funds tab → Category → "Liquid / Overnight" or "Ultra Short / Low Duration" → sort by Direct TER — Lowest first. Liquid fund TERs typically range 0.10%–0.40%, with commission gaps of 0.05%–0.20% — much smaller than equity funds where the gap can exceed 1.0%. For gilt and long-duration debt, the commission gap is modest, making ELSS and sectoral equity funds the higher priority for Direct plan switching.
What is trail commission in a mutual fund and how is it different from upfront commission?
Trail commission is an ongoing annual fee your distributor earns as long as your money stays in a Regular plan — typically 0.40%–1.00% of your investment per year, paid by the AMC from the fund's expense ratio. SEBI banned upfront commission in 2018 to reduce mis-selling; all distributor income is now trail-only. On ₹10 lakh with a 0.80% trail, your broker earns ₹8,000/year — every year — regardless of fund performance. The Commission Gap column in this screener shows the exact trail commission per fund from AMFI's official data.
How do I check if my SIP is in a Direct or Regular plan?
Check your account statement from CAMS or KFintech (covers all AMCs) — look at the scheme name. 'XYZ Fund — Direct Plan — Growth' is Direct; 'XYZ Fund — Regular Plan — Growth' is Regular. If you invested through a bank app (SBI YONO, HDFC Bank), it is almost certainly Regular. If you used the AMC's own website, MFCentral, Coin by Zerodha, or Groww's Direct option, it is Direct. The word 'Direct' will always appear explicitly in the scheme name.
Is 0.75% expense ratio too high for a mutual fund?
Depends on the category. For an active flexi-cap or mid-cap Direct plan, 0.75% is acceptable. For a large-cap Direct fund, it is slightly high — competitive options are 0.40%–0.65%. For any index fund or ETF, 0.75% is way too high — Nifty 50 ETFs are available at 0.04%–0.12%. For a Regular plan, 0.75% would actually be unusually cheap — most Regular equity plans charge 1.2%–2.0%. See the benchmarking table above, or sort this screener within any category to compare your fund against peers.
What is Base TER vs Total Expense Ratio — are they the same?
BER (Base Expense Ratio) is the new official name under SEBI's 2026 regulations, replacing TER. The practical difference: BER excludes GST on management fees, SEBI regulatory fees, and stamp duty — these are now charged separately and disclosed transparently. Previously they were bundled inside TER. For comparing two funds, BER and TER are interchangeable — the figure in AMFI disclosures and in this screener is your actual annual cost as a percentage of your investment. The renaming is about transparency in breakdown, not a change in what you pay.
Mutual fund ka expense ratio kya hota hai? Direct plan kyun sasta hota hai?
Expense ratio (ab Base Expense Ratio ya BER kehte hain) woh annual fee hai jo mutual fund aapke investment se automatically deduct karta hai — chahe market upar jaye ya neeche. Direct plan mein yeh fee kam hoti hai kyunki koi distributor nahi hota — aap seedha AMC se invest karte hain. Regular plan mein distributor ka commission (typically 0.5%–1.0% per year) is fee mein add ho jaata hai. ₹1 lakh par 1% ka antar = ₹1,000 per year extra charge. 20 saal mein yeh antar aapke final corpus ka 18%–22% ho sakta hai. 'Comm. Gap' column mein dekho ki aapke fund mein kitna commission distributor ko ja raha hai.
Regular plan se Direct plan mein switch karne par tax lagta hai kya?
Haan — Regular se Direct switch karna redemption maana jaata hai, isliye capital gains tax lagta hai. Equity funds mein: 1 saal se kam hold kiya toh STCG 20%, 1 saal se zyada toh LTCG 12.5% (₹1.25 lakh per year tak exempt). Debt funds mein: gains aapke income slab rate par tax hote hain. Same AMC ke andar switch karne par exit load generally nahi lagta (exit load period ke baad), lekin apna specific fund check karein. Calculation yeh hai: switch par ek-baar ka tax vs. har saal bachne wala TER difference — zyada tar investors ke liye switch 2–4 saal mein payoff ho jaata hai.
How to Use the Fund Cost Screener
Three steps — takes under 30 seconds.
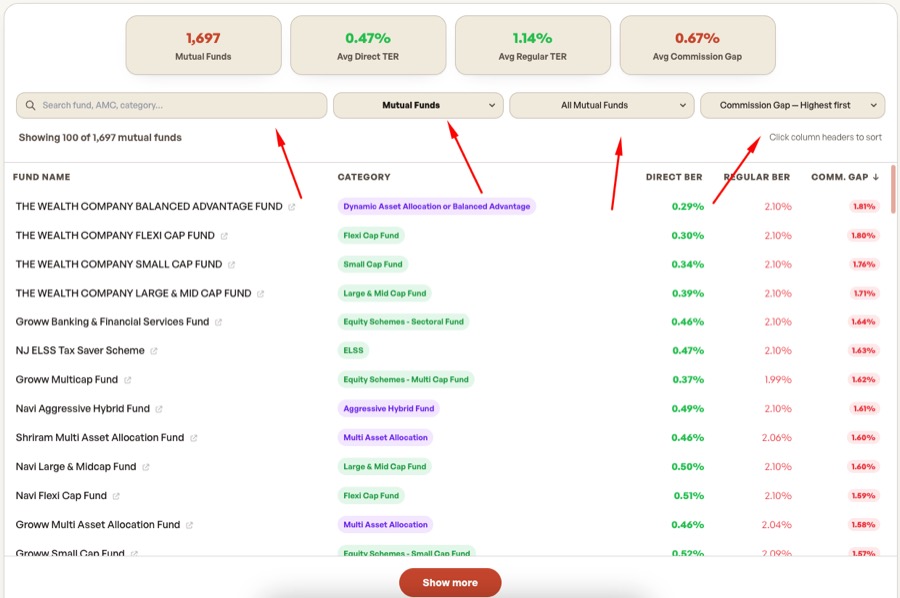
Choose Mutual Funds or ETFs — then search or filter
Select the Mutual Funds tab for 1,600+ schemes with Direct vs Regular TER, or the ETFs tab for 400+ exchange-traded funds. Type any fund name or AMC in the search box, or pick a category from the dropdown — Large Cap, ELSS, Liquid, Gilt, Sectoral, Fund of Funds, and more.
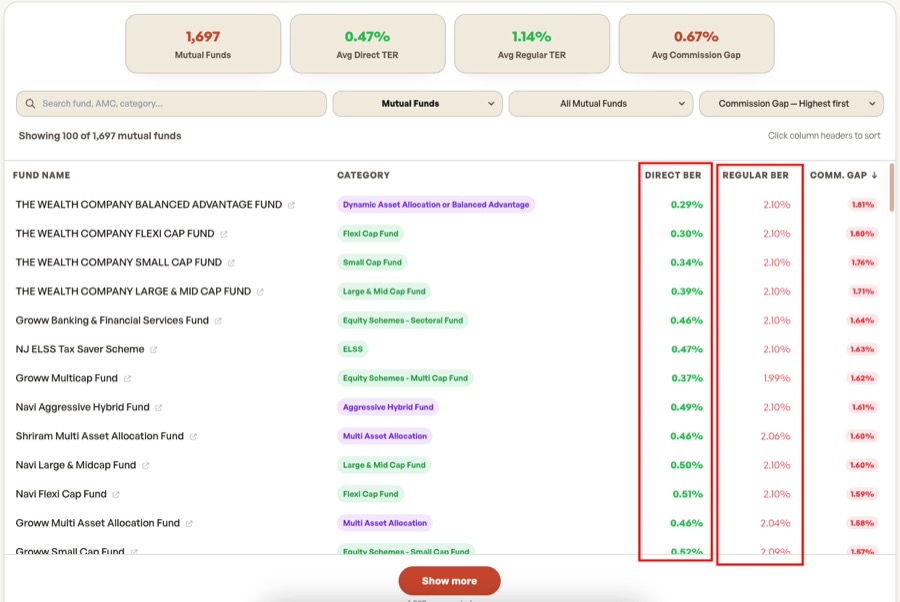
Read Direct TER, Regular TER, and the Commission Gap
Each row shows the fund's Direct plan expense ratio, Regular plan expense ratio, and the Commission Gap — the exact annual percentage going to your distributor, not your returns. Sort any column by clicking its header. A 1% Commission Gap on ₹10 lakh = ₹10,000/year to the broker.
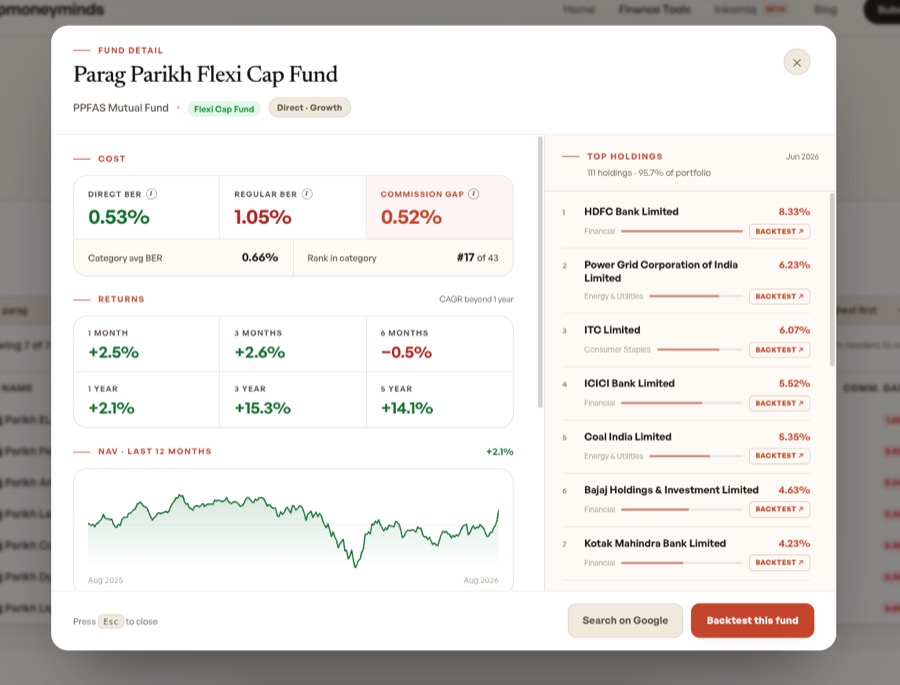
Click any fund for returns detail — or backtest it in one click
Click any row to open the fund detail panel — 1M, 3M, 1Y, 3Y, and 5Y returns alongside the expense ratio. Hit the Backtest button to open that fund directly in the Mutual Fund Backtester and see real historical SIP or lumpsum performance over any date range.
The Real Cost of Regular Plans — What the Numbers Show
These are approximate calculations based on historical fund data and typical commission gaps. Actual results vary by fund, AMC, and market conditions. Past performance does not guarantee future results.
Small Cap · 10 Years
Nippon India Small Cap Fund
Comm. gap ≈ 1.0% · ₹10,000/month SIP
Approximate ₹6–9 lakh more in Direct over 10 years — that sum went to the distributor.
Large Cap · 15 Years
SBI Bluechip Fund
Comm. gap ≈ 0.75% · ₹5,000/month SIP
Even a 0.75% gap compounds into ₹4–6 lakh less over 15 years on a modest SIP.
ETF · No Commission Gap
Nifty 50 ETF (any AMC)
Expense ratio 0.04%–0.12% · Zero gap
ETFs have no Direct/Regular distinction — no distributor layer, ever. The cheapest way to own the Nifty 50.
ELSS · Tax + Commission
HDFC ELSS Tax Saver
Comm. gap ≈ 0.85% · ₹1.5 lakh/year (80C limit)
Investing for tax saving in a Regular ELSS costs ₹1,275+ more per year than the identical Direct plan — with zero extra benefit.
Approximate ranges based on typical returns for each category and publicly available TER data from AMFI. Actual corpus depends on market conditions, NAV timing, and specific fund performance. Not investment advice.
Related Tools
Direct vs Regular Calculator
See the exact rupee cost of Regular vs Direct plans over your investment timeline.
Mutual Fund Backtester
Test how any mutual fund would have performed historically with SIP or lumpsum.
Direct vs Regular — Full Guide
How distributor commissions work and where to invest in Direct plans.
The FoF Convenience Trap
Why Fund of Funds costs stack up and what to use instead.

Kuldeep Singh
Personal finance writer & developer
Kuldeep builds free, data-driven tools for Indian investors using only official AMFI, NSE, and BSE sources — no paywalls, no signups. He covers mutual fund costs, SIP investing, ETFs, and XIRR at Deep Money Minds.