NSE stocks

Dividend Stocks Screener India

The only free dividend stocks screener for NSE India showing 3-year Dividend CAGR, TTM yield and 10-year consistency score for every dividend-paying stock — powered by real NSE corporate actions data, updated daily. No login required.

Dividend Screener Stock Backtester Fund Finder MF Comparer All tools
Guide

How to use the Dividend Screener

Takes under a minute — no sign-up required.

1

Set your filters

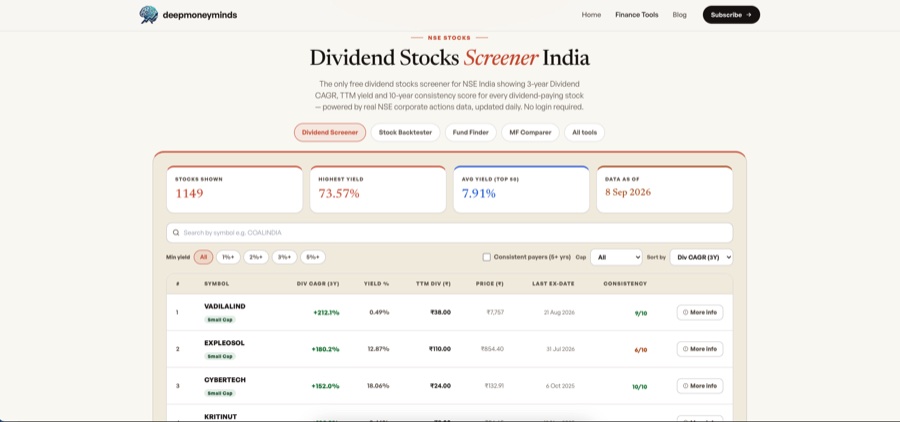
Use the yield chips (2%+, 3%+, 5%+, 8%+) to set a minimum dividend yield floor. Toggle "Consistent only" to show only companies that paid dividends in 7 or more of the last 10 years. Use the cap dropdown to limit to Large, Mid, or Small Cap stocks. All filters apply instantly.

Dividend Stocks Screener India showing 1149 NSE stocks ranked by 3-year Dividend CAGR with stat tiles for highest yield, avg yield and data date
The screener loads 1,000+ NSE dividend stocks instantly, ranked by Div CAGR (3Y)
2

Search or read the table

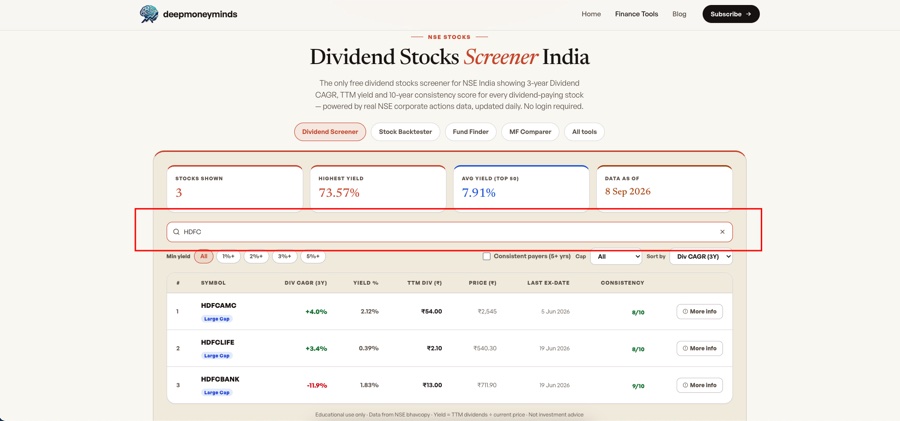
Type any symbol in the search box to instantly filter. Stocks are ranked by Div CAGR (3Y) — how fast the dividend per share has grown over 3 years. Yield % is shown alongside but is secondary — high yield can simply mean the stock price fell. Consistency shows how many of the last 10 years the company paid — 10/10 means every single year.

Search results for HDFC showing HDFCAMC, HDFCLIFE and HDFCBANK with their dividend CAGR, yield and consistency scores
Search any NSE symbol — results filter live as you type
3

Tap a stock for full detail

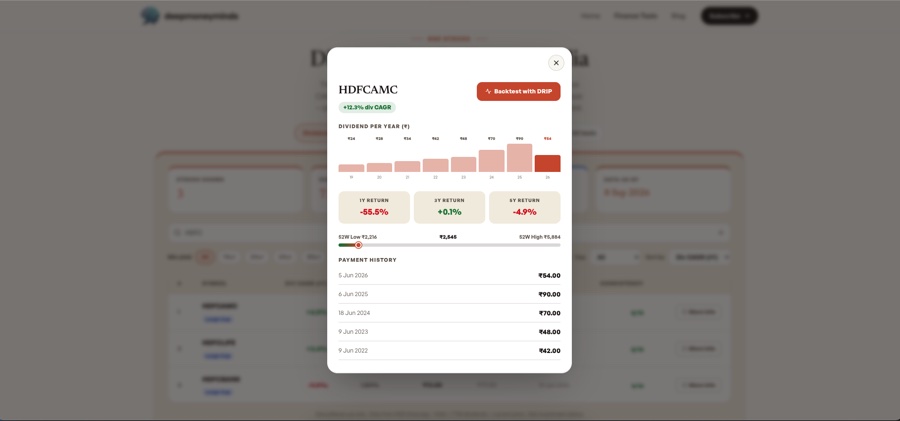
Click any row (or the "More Info" button) to open the detail panel. It shows the full year-by-year dividend history as a bar chart, 1Y / 3Y / 5Y price returns, the 52-week price range, and individual payment dates going back several years — so you can see at a glance whether dividends are growing, shrinking, or lumpy.

HDFCAMC detail panel showing +12.3% dividend CAGR, year-by-year dividend bar chart from 2019 to 2026, price returns and payment history
Detail panel shows the full dividend growth chart, price returns and individual payment history
Why this tool

Why track dividend yield on NSE stocks?

The problem with most dividend research

Most Indian stock portals show dividend data buried inside individual stock pages — you'd need to manually check hundreds of companies to find the ones with the best yields. This screener aggregates NSE corporate action data across all dividend-paying stocks and ranks them by yield in a single view, with filters for cap category and consistency so you don't waste time on companies that only paid once.

Yield is a snapshot, not a promise

Dividend yield is calculated as: TTM dividends ÷ current stock price × 100. If the stock price falls sharply while dividends stay the same, the yield rises — which can look attractive but may signal trouble. Always check the Consistency score (how many years the company paid) and the year-by-year chart in the detail panel before reading a high yield as a positive sign.

What "TTM dividend" actually means

TTM stands for Trailing Twelve Months. It sums all individual dividend payments whose ex-date fell within the last 12 months. Some companies pay quarterly, others annually. TTM normalises across payment schedules — a company that pays ₹5 four times a year shows ₹20 TTM, the same as one that pays ₹20 in a single annual payout.

Why the Consistency score matters more than yield alone

A company that has paid dividends every single year for the last 10 years has demonstrated a long-term commitment to returning cash to shareholders — even through market cycles. A consistency score of 10/10 is a stronger signal of a reliable dividend payer than a single high-yield year, which could be a one-time special dividend unlikely to recur.

Where does the dividend data come from?

All dividend data is sourced from NSE's official corporate actions filings — the same records companies are required to submit to the exchange. Every listed company must disclose dividends, rights issues, and bonus shares to NSE under SEBI's LODR Regulations. This makes the data highly reliable — it isn't scraped from news sites or estimated. Dividend announcements along with declared amounts and ex-dates are pulled daily. For any company's full dividend history, you can also cross-verify directly on the NSE stock quote page under Corporate Actions.

From the data

What dividend data reveals

Patterns from NSE corporate actions data · Past dividends do not guarantee future payouts · Not investment advice

PSU · High Consistency

Coal India

One of the highest-yielding large-cap PSU stocks on NSE — has paid dividends every year for over a decade, often multiple times a year. Frequently appears at the top of this screener when filtered to Large Cap consistent payers.

FMCG · Steady payer

ITC

A long-standing dividend favourite in India — ITC has consistently grown its dividend per share over the years. Often cited as the textbook example of a dividend growth stock in the Indian context.

Metals · Cyclically high yield

Vedanta

A recurring name at the top of high-yield screens — Vedanta has paid large dividends in commodity upcycles. The yield can look very high, but the payout history is uneven. This is exactly the kind of stock where the Consistency score and year-by-year chart in the detail panel matter most.

Small Cap · Hidden yield

Small Cap filter

Many small-cap stocks with modest price appreciation show surprisingly high yields because their dividends have grown while the stock stayed range-bound. Use the Small Cap filter with Consistent Only to find names that don't appear on mainstream dividend lists.

Based on NSE corporate actions data. Dividends change each year. This is not investment advice.

FAQ

Frequently asked questions

How is dividend yield calculated here?

Yield = total dividends paid in the last 12 months ÷ current share price × 100. This is the trailing twelve-month (TTM) yield — it reflects what you would have earned in dividends if you held the stock for a full year at the current price.

What is Dividend CAGR (3Y) and why does it matter more than raw yield?

Dividend CAGR (3-Year) measures the compound annual growth rate of a company's dividend payouts over the last three years: (TTM dividend ÷ dividend 3 years ago)^(1/3) − 1. A high CAGR means the company is actively growing its dividends year over year — which is a much stronger signal than a high raw yield. Raw yield can be artificially high simply because the stock price crashed; CAGR tells you whether management is genuinely committed to increasing returns to shareholders. Stocks with both a high yield AND a positive CAGR are the most sought-after dividend growth investments.

What does "consistency" mean?

Consistency shows how many of the last 10 calendar years the company paid at least one dividend. A score of 10/10 means it has paid every year for a decade — a strong signal of dividend reliability. Use the "Consistent payers" filter to show only stocks with 5+ years.

Where does the dividend data come from?

All dividend data is sourced from NSE's official corporate actions announcements — the same data NSE publishes on its website. It covers all equity series stocks (EQ, BE, SM, BZ, IL) from 2013 onwards and is updated daily.

Why does a stock show a very high yield (20%+)?

Extremely high yields often indicate a stock whose price has fallen sharply while dividends haven't adjusted yet, or a one-time special dividend. High yield alone is not a buy signal — always check whether the company can sustain the payout from its earnings. Use the backtester to see the full price history.

How do I backtest a dividend stock with DRIP?

Click the "More Info" button next to any stock — it opens a detail panel, then tap Backtest to open the Stock Return Calculator pre-loaded with that ticker. Enable DRIP to see how reinvesting each dividend would have compounded your returns over any period up to 10 years.

Which NSE sectors typically have the highest and most consistent dividend yields?

PSU stocks in energy, mining and utilities — Coal India, ONGC, Power Grid, NTPC, REC, PFC — are consistently among the highest-yielding large-cap dividend payers. SEBI's mandate requires PSUs to distribute a significant share of profits. FMCG stocks like ITC and HUL are known for consistent payouts. IT exporters like Infosys and HCL Technologies have increasingly grown dividends as their cash flows matured.

What is an ex-dividend date and why does it matter?

The ex-dividend date is the cutoff set by the company — you must hold the stock before this date to receive the upcoming dividend payment. If you buy on or after the ex-date, you will not receive that payout. NSE requires companies to set the ex-date at least 2 trading days before the record date. The screener shows the most recent ex-date for every stock so you can see how recent the last payout was.

How is this different from Screener.in or Tickertape dividend screeners?

Most Indian stock screeners show dividend yield as a single static number. This screener uniquely shows 3-year Dividend CAGR — the rate at which dividends are actually growing — as the primary ranking metric. This tells you whether a company is genuinely rewarding shareholders year over year or just had a high yield because the stock price fell. The 10-year consistency score is also computed upfront for all 1,000+ dividend-paying NSE stocks without any manual work.

How do I filter for only consistent dividend payers?

Toggle the "Consistent payers" switch above the results — it filters to only show stocks that have paid dividends in 5 or more of the last 10 calendar years. For an even stricter screen, look for stocks with a consistency score of 8/10 or higher in the results table — these are companies that have paid dividends in 8 of the last 10 years without skipping.

Is this dividend screener free? Do I need to create an account?

Completely free and no account required. Open the page and all data loads instantly — no email, no signup, no paywall. The screener covers 1,000+ dividend-paying NSE stocks with full dividend history, CAGR calculations and consistency scores, all available without any registration.

Does this screener cover REITs and InvITs?

REITs and InvITs listed on NSE pay "distributions" rather than dividends under NSE's corporate action labelling, which may cause them to appear inconsistently in this screener. Embassy REIT, Mindspace REIT and IndiGrid InvIT are examples that pay regular distributions. The screener is optimised for equity stocks — check the individual stock detail panel for REIT payouts.

How often is the dividend data updated?

The dividend data is updated daily via an automated pipeline that fetches NSE's official bhavcopy and corporate actions files every morning. New dividend announcements typically appear within 24 hours of NSE publishing them. The "Data as of" date at the top of the screener shows the last update timestamp.
Kuldeep Singh — Deep Money Minds

Built by

Kuldeep Singh

Personal Finance Writer & Developer

Kuldeep builds free, data-driven financial tools for Indian investors — covering mutual funds, ETFs, SIP investing, and portfolio analysis at Deep Money Minds. The Dividend Screener is built on live NSE corporate action data, updated daily, so you always see real dividend yields and payment history without any manual research.

More about me