Is the Indian market fearful or greedy right now? One score. Four signals. Updated daily after market close.
The Market Mood Index is a fear and greed indicator for the Indian stock market. It reads India VIX today, Nifty 50 RSI-14, the distance from the 200-day moving average, and the 52-week high-low range — then maps them to a single 0–100 score. Think of it as the Nifty fear and greed index: 0 is Extreme Fear (market panic), 100 is Extreme Greed (euphoria). Long-term investors use it to time lumpsum purchases — buying more when the crowd is fearful, going slow when greed is high. No login. No ads. Updated daily after NSE market close.
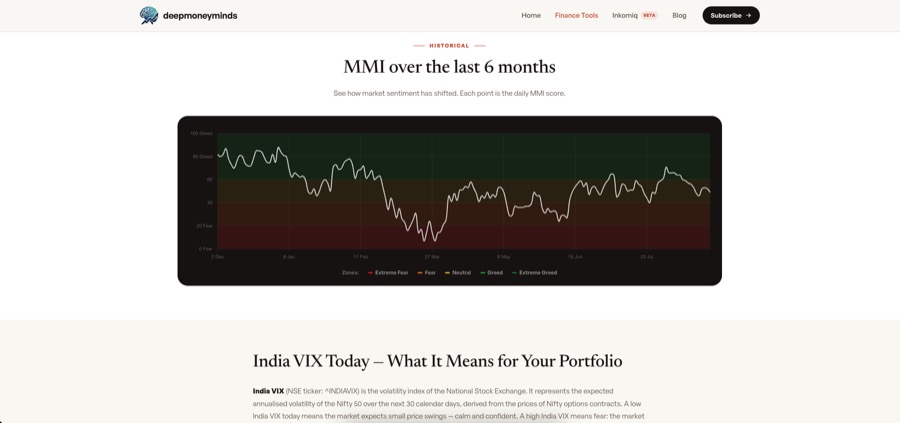
See how market sentiment has shifted. Each point is the daily MMI score.
Sentiment snapshot for 9 NSE sectors — based on RSI, 200-DMA, 52-week range, and realized volatility. For context only, not a buy/sell signal.
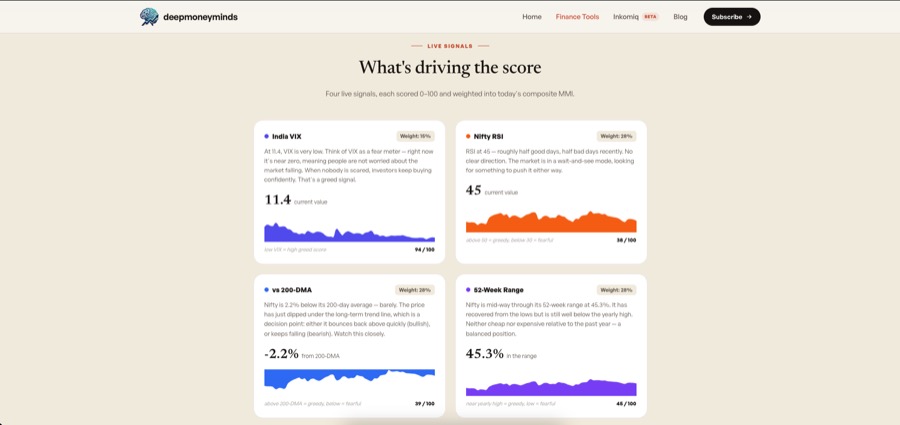
Four signals, each scored 0–100 and weighted into today's composite MMI.
India VIX (NSE ticker: ^INDIAVIX) is the volatility index of the National Stock Exchange. It represents the expected annualised volatility of the Nifty 50 over the next 30 calendar days, derived from the prices of Nifty options contracts. A low India VIX today means the market expects small price swings — calm and confident. A high India VIX means fear: the market expects big moves and investors are buying protection.
A normal India VIX range is roughly 13–18. Values below 12 signal complacency — the crowd is very relaxed, which sometimes precedes a correction. Values above 20 signal stress, and above 25 indicate serious market fear (these often coincide with sharp Nifty falls). The highest India VIX reading in recent history was during the COVID crash of March 2020, when it briefly exceeded 80.
Because VIX and the Nifty typically move in opposite directions, a spike in India VIX today is usually a signal that the Nifty is falling or expected to fall. Conversely, when VIX drops below 12–13 and the Nifty is near its 52-week high, it often means the market is priced for perfection — a time for long-term investors to tread carefully and hold back fresh lumpsum investments.
The live India VIX chart on this page (in the signal cards above) shows the past 60 days of India VIX readings, so you can see the trend rather than just today's number.
When India VIX crosses 20, the options market is pricing in elevated risk of a Nifty correction within the next 30 days. Historically, sustained VIX readings above 20 have coincided with sharp Nifty drawdowns. For a long-term investor this is not a reason to panic — it is a signal to pause any planned lumpsum investment and wait for clarity. Once VIX starts falling back below 18, fear is fading and the market is stabilising. India VIX data is published by the National Stock Exchange (NSE) and stored on our own servers via daily NSE bhavcopy.
The most common use case is calibrating lumpsum investments. Rather than trying to time the exact bottom — which is impossible — long-term investors use the MMI to avoid the worst entry points (Extreme Greed) and tilt toward better ones (Fear or Extreme Fear). A practical approach: keep your SIP running regardless of the score, but allocate any spare lumpsum capital when the MMI is below 40, and hold back when it is above 70. This is not a trading system — it is a discipline tool that stops you from buying aggressively when the crowd is most euphoric. For guidance on regulations around mutual fund investing in India, refer to SEBI's investor education resources.
For long-term investors. Not advice — context.
The market is in a panic. VIX is elevated, Nifty is well below its 200-DMA, RSI is deeply oversold. These are historically the best times to invest more if you have a long horizon — but it requires conviction because prices may fall further before recovering.
Sentiment is negative. Investors are cautious, selling pressure is present. SIP investors benefit here — you're buying more units at lower prices. If you have spare capital, consider adding to existing positions rather than starting new ones.
The market is in balance — no strong fear or greed signal. This is the default state most of the time. Stick to your regular SIP and don't make major allocation changes based on mood alone. Wait for a clearer signal.
The market is optimistic. Momentum is strong, VIX is low, Nifty is well above the 200-DMA. Don't chase new positions at inflated prices. If you're overweight equity, this is a good time to rebalance toward your target allocation.
Euphoria. Everyone is bullish, valuations are stretched, RSI is overbought. Historically these levels precede corrections. Don't stop your SIP — but avoid lumpsum investments and definitely don't add leverage. Consider booking partial profits if you're sitting on large gains.
The MMI is an educational tool, not financial advice. Market mood is one input — always consider your own financial goals and risk tolerance before making investment decisions.
What makes this different — and when it actually helps.
Most Indian investors judge market mood from TV channels, WhatsApp forwards, YouTube videos, or Twitter/X trending posts. The problem: all of these reflect human emotion, not data — and they amplify fear during crashes and overconfidence during rallies. Exactly the opposite of what a contrarian investor needs. Even financial news headlines tend to be reactionary, written after the move has already happened. The MMI flips this — it reads the same data the market is generating and gives you a dispassionate score before you make a decision.
Each signal captures a different dimension of market psychology. India VIX measures forward-looking fear — what traders expect to happen. RSI-14 measures recent momentum — whether prices have been climbing or falling fast. vs 200-DMA measures long-term context — whether the market is above or below its year-long trend. And 52-week range measures relative price level — cheap or expensive vs the past year. Together they cover four independent angles. A signal being "fearful" on all four simultaneously is a much stronger reading than one noisy day of VIX spiking while everything else stays calm.
Most Indian market sentiment tools are black boxes — they give you a score with no explanation of how it was built. This MMI shows its work: every signal card displays the latest value, a 60-day sparkline, the mapping formula in plain words, and the individual score out of 100. You can see exactly why the composite score is 42 or 68 on any given day. All data — India VIX and Nifty 50 — comes from NSE bhavcopy, stored on our own servers. No paid data feeds, no third-party APIs, no subscriptions.
During the COVID crash of March 2020, India VIX exceeded 80 — its all-time high — and the Nifty 50 fell nearly 38% from its January peak. A composite MMI during that period would have been deep in Extreme Fear. In contrast, during the Nifty's all-time highs of late 2021, VIX was low, RSI was overbought, and the index was far above its 200-DMA — classic Extreme Greed conditions that preceded a ~15% correction into mid-2022. The Budget-day correction of February 2025 pushed the score into Fear territory as institutional selling drove the Nifty sharply lower — another historically reasonable entry zone. Historical patterns are not guarantees, but they illustrate how the MMI captures inflection points that matter to long-term investors.
The MMI is most useful for three decisions: (1) Lumpsum timing — before deploying a large one-time investment, check the score. Below 40 historically offers better value; above 70 warrants patience. (2) Rebalancing trigger — when the score is in Extreme Greed and your equity allocation has drifted above target, use it as a nudge to rebalance toward debt. (3) Calm during crashes — when markets are falling and everyone is panicking, seeing an Extreme Fear score reminds you that this is exactly what historically good entry points look like. It is not a trading system, a short-term signal, or a market timing oracle. It is a discipline tool for long-term investors who want data, not feelings.
Approximate readings based on historical data. Past performance does not guarantee future results.
India VIX surged past 80. Nifty fell ~38% from its Jan peak. Every signal was in deep fear territory. Investors who held or added through this period saw exceptional recovery over the next 18 months.
Institutional selling drove the Nifty sharply lower on budget day concerns. VIX spiked, RSI fell into oversold territory. The market stabilised and recovered over the following months — a reasonable accumulation zone in hindsight.
The Nifty was in a strong uptrend, trading well above its 200-DMA, RSI was elevated. The Greed zone did not immediately precede a crash — the market continued higher. A signal to slow lumpsum additions, not to exit.
VIX was low, RSI overbought, Nifty far above 200-DMA. Classic Extreme Greed. The market subsequently corrected ~15% into mid-2022. Not a crash — but fresh lumpsum investments made at this peak took over a year to recover.
MMI scores shown are approximate reconstructions based on signal data available at the time. Exact composite scores depend on the data range used. This is educational context, not a prediction or investment advice.
Three steps — takes under a minute.
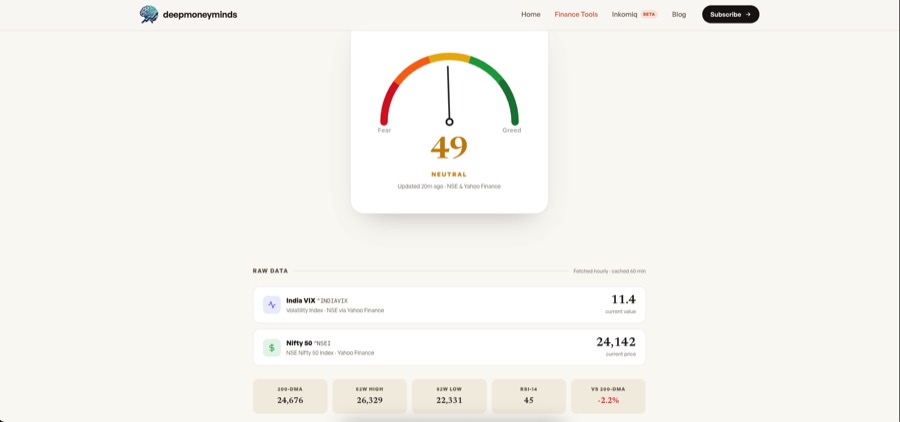
The semicircular gauge at the top shows the current MMI score from 0 to 100, with the needle pointing to the zone. The score number and zone name (Extreme Fear → Extreme Greed) are your headline sentiment reading. The badge shows whether the market is open and how recently the data was updated.
Scroll to "What's driving the score." Each of the four cards — India VIX, Nifty RSI-14, vs 200-DMA, 52-Week Range — shows its latest value, a 60-day sparkline, and its individual score out of 100. This tells you why the composite score is where it is. If VIX is the only fearful signal but RSI and DMA look greedy, the overall fear reading is less severe than if all four are red.
The 1-year historical MMI chart shows every daily score as a line with coloured zone bands in the background. A score that has been rising from Fear into Greed is a different signal than one that has been stuck in Extreme Greed for weeks. Look for the trend, not just today's number — context from the last few months shows whether the current mood is a temporary spike or a sustained shift.
Built by
Kuldeep Singh
Personal Finance Writer & Developer
Kuldeep builds free, data-driven financial tools for Indian investors — covering mutual funds, ETFs, SIP investing, and market analysis at Deep Money Minds. The Market Mood Index was built to give long-term investors a simple way to check market sentiment without having to interpret raw VIX or RSI numbers themselves.
More about me