What is a stock return calculator?
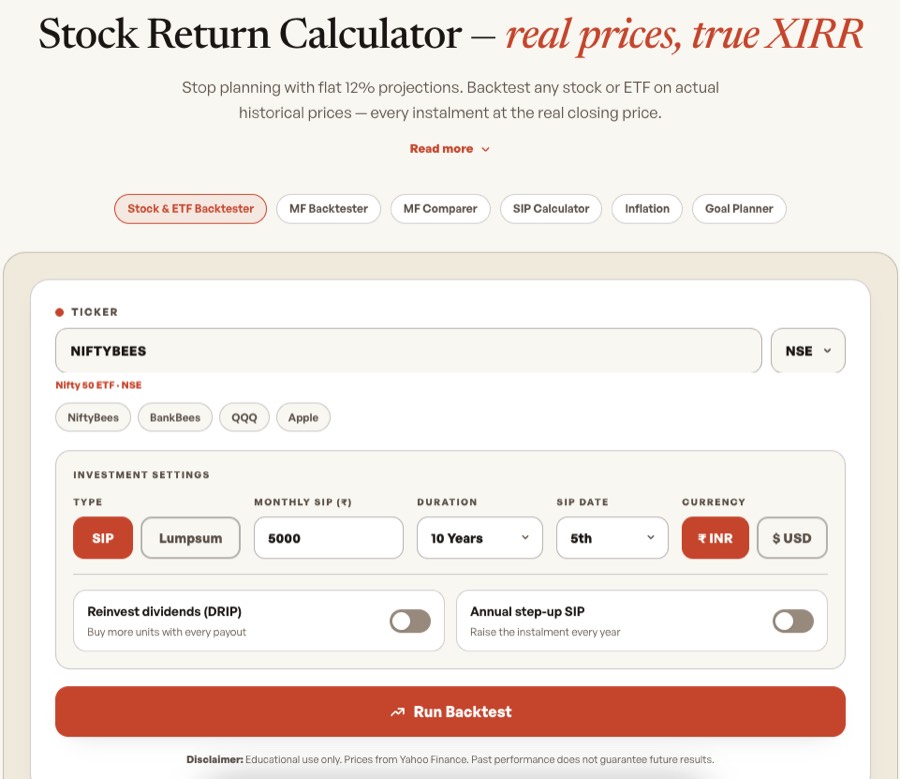
A stock return calculator computes the real historical return — XIRR, total profit and portfolio value — for any investment in a stock or ETF using actual closing prices from the exchange. Unlike flat-rate calculators, it accounts for the price paid on each investment date, market crashes, dividends and recoveries, giving a true picture of what your money actually earned. This tool supports SIP (monthly investing), lumpsum, and optional dividend reinvestment (DRIP) for any NSE-listed stock or ETF.
How do I backtest NiftyBees SIP returns?
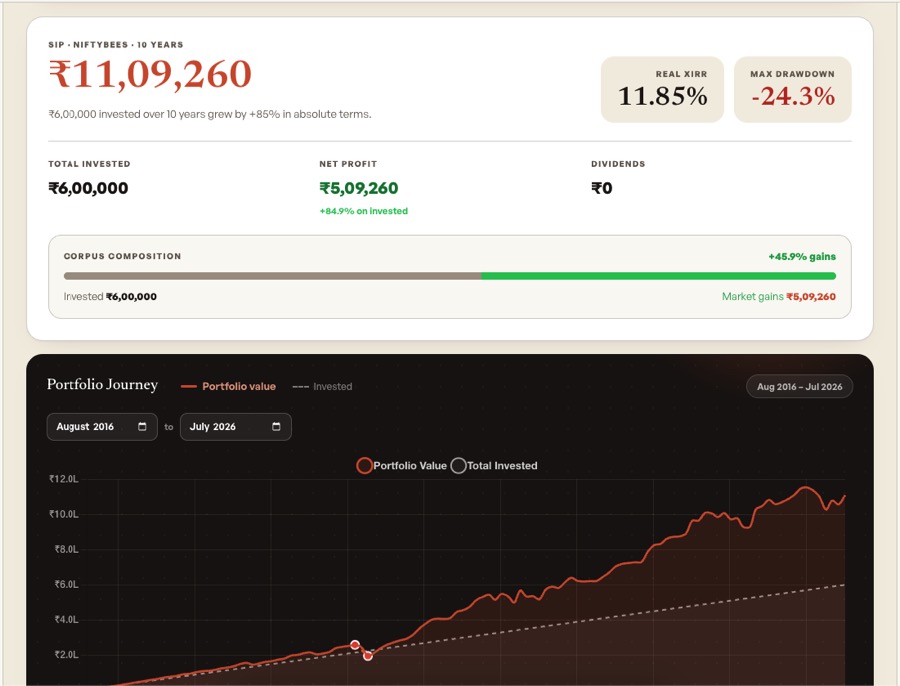
Pick NiftyBees from the quick links (or type NIFTYBEES), set your monthly amount and duration, then run the backtest. The tool uses real NSE bhavcopy closing prices and reports actual XIRR, portfolio value and how NiftyBees behaved through every crash in that window.
What is XIRR, and why not CAGR?
XIRR is the true annualised return for a series of cash flows on different dates — exactly what a SIP is. CAGR assumes one lumpsum and one exit, so it misstates how a monthly SIP performed. This tool uses your real purchase dates and prices.
What is DRIP and should I turn it on?
DRIP reinvests each dividend into more units at that day's price instead of taking it as cash. For dividend-paying ETFs like NIFTYBEES or BANKBEES it meaningfully lifts long-run XIRR, so turn it on to see the realistic compounded return.
Which stocks and ETFs can I backtest?
Any NSE-listed stock or ETF — enter the ticker symbol. Popular ones: NIFTYBEES, BANKBEES, GOLDBEES, MON100, JUNIORBEES, MID150BEES, ITBEES, SILVERBEES. Individual stocks like RELIANCE, INFY, TCS or HDFCBANK work identically.
How did a NiftyBees SIP survive the 2020 COVID crash?
The Nifty 50 fell nearly 38% between January and March 2020. A running SIP kept buying, so those months bought far more units per rupee. The market recovered by December 2020 and those cheap units amplified long-run XIRR. Run a 5-year backtest to see the dip and recovery.
Does the SIP date change returns?
For SIPs of five years or more the XIRR gap between dates is usually under 0.3–0.5% a year — entry-point randomness averages out over hundreds of purchases. You can test any date from the 1st to the 28th here and see the exact difference.
What is maximum drawdown and why does it matter?
It is the largest peak-to-trough fall in your portfolio value during the journey — the worst on-paper loss you would have watched. A -40% drawdown that recovers is survivable for a disciplined investor, but it is exactly what makes unprepared investors sell.
How is this different from a normal SIP calculator?
A normal calculator assumes a flat annual return. This one replays actual prices — crashes, bull runs, dividends, recoveries — and adds a journey chart, maximum drawdown, lumpsum comparison and optional dividend reinvestment.
Where does the data come from?
Daily closing prices come from NSE bhavcopy archives, served from our own servers. Dividend and split data comes from NSE corporate actions records — no third-party dependency.
Is it free? Do I need an account?
Completely free, no signup, no login, no paywall. Backtest as many tickers and periods as you like.
Can I use this as a dollar cost averaging (DCA) calculator?
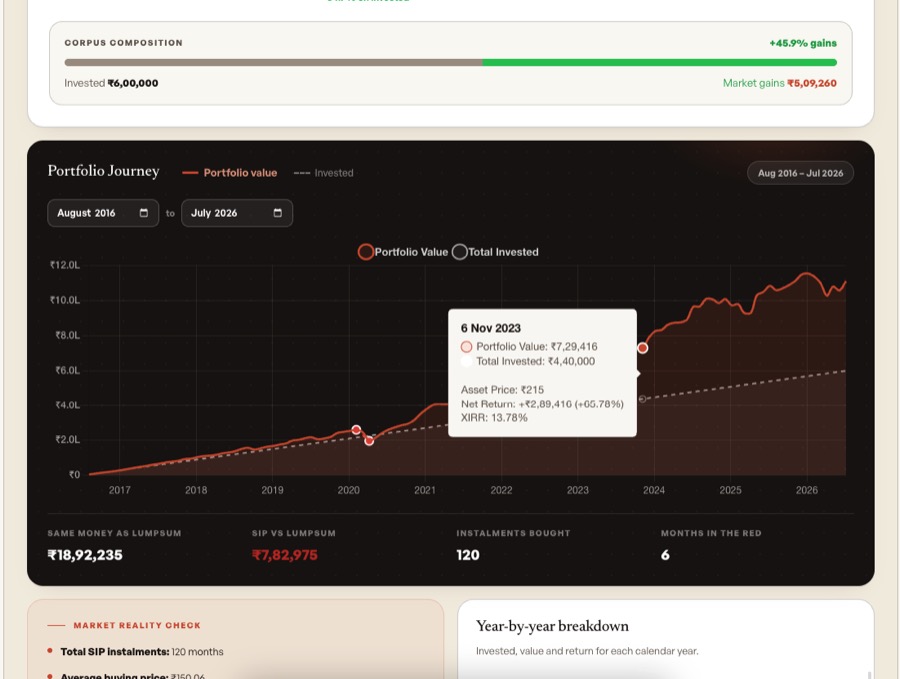
Yes. SIP mode is precisely a dollar cost averaging calculator — it invests a fixed amount on a fixed date every month, buying more units when prices are low and fewer when prices are high. The tool shows exactly how DCA performed on any stock or ETF using real historical prices, including the averaging effect through market crashes like 2008 and 2020. You can see the month-by-month buying pattern in the portfolio journey chart and the year-by-year table.
How does a SIP compare to investing the same money as a lumpsum?
The tool calculates both automatically. After running a SIP backtest, the chart footer shows what the same total invested amount would be worth if invested as a lumpsum on day one, and the XIRR gap between the two approaches. SIP wins in falling markets because it keeps buying more units at lower prices; lumpsum tends to win in consistently rising markets because all capital is deployed from day one and benefits from the full compounding period. Use the toggle to switch modes and compare directly.
What is a step-up SIP calculator and how does the annual step-up feature work?
A step-up SIP (also called a top-up SIP) increases your monthly investment by a fixed percentage every year. Starting at ₹5,000/month with a 10% annual step-up means ₹5,500 in year two, ₹6,050 in year three, and so on — mirroring salary growth. Over 10 years this dramatically increases your final corpus and XIRR compared to a flat SIP. Enable the Annual Step-Up toggle in this calculator, set the increment from 1–50%, and run the backtest to see the exact historical impact on your portfolio value.
What if I had invested ₹10,000 in NIFTYBEES (or any stock) 10 years ago?
Switch to Lumpsum mode, enter your hypothetical amount (e.g. ₹10,000), set the duration to 10 years, type the ticker (NIFTYBEES, RELIANCE, HDFCBANK — any NSE-listed stock or ETF) and click Run Backtest. The tool uses real NSE bhavcopy prices from that exact date and shows you precisely what it would be worth today, your actual XIRR, and the full portfolio journey chart with every peak and trough along the way.