Pick up to 3 indices
What the index did
Dividends reinvested (TRI). Falls counted month-end to month-end.
₹1 lakh invested at the start
What it was worth at each month-end.
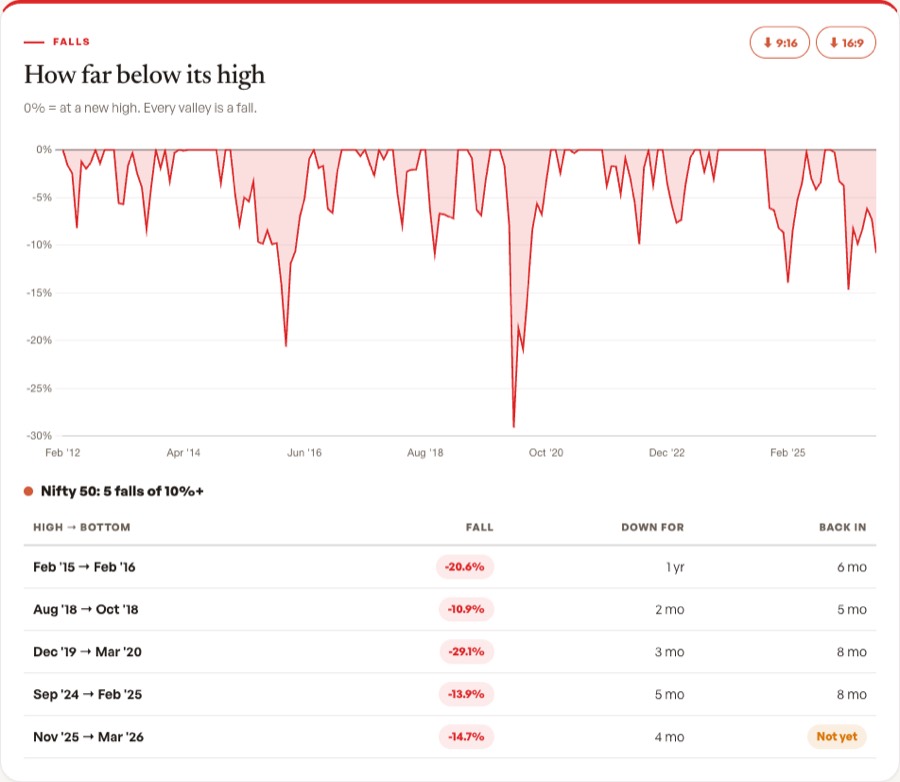
How far below its high
0% = at a new high. Every valley is a fall.
Year by year
Return for every N-year period
Each point = yearly return (CAGR) if you invested N years before that month and held till then.
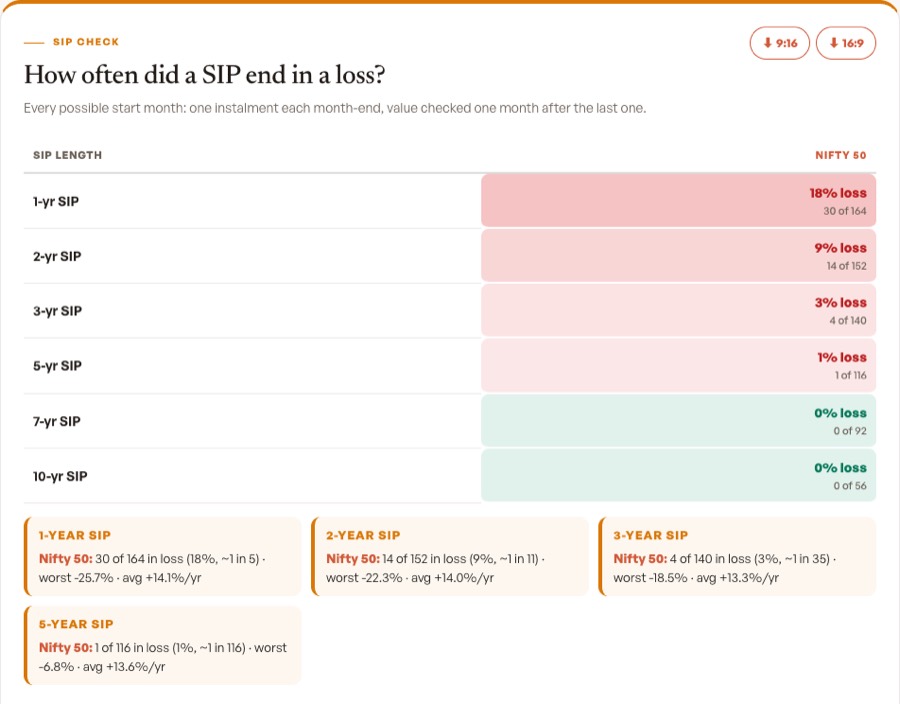
How often did a SIP end in a loss?
Every possible start month: one instalment each month-end, value checked one month after the last one.
Every SIP, by start month
Open a ready-made comparison
Tap to load it instantly.
Nifty 50, Nifty 500, Midcap and Smallcap returns since 2012
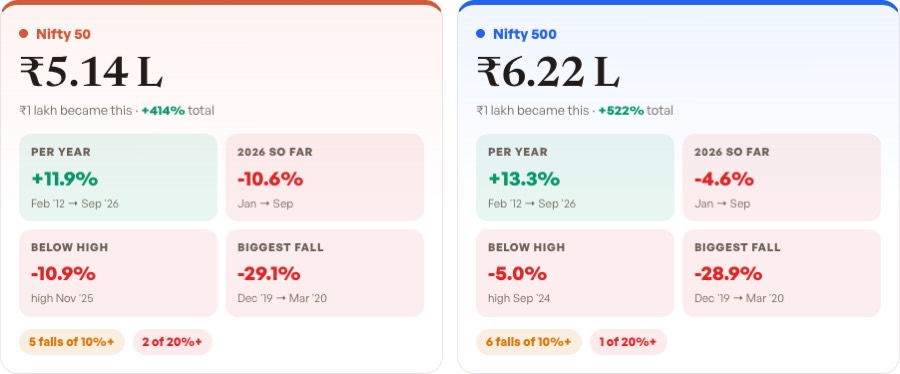
All numbers below are from the Total Return Index (TRI), which adds dividends back in. This is closer to what an index fund investor actually got than the plain Nifty number you see on the news. The period is February 2012 to September 2026 (part month), about 14.6 years. Source: Nifty Indices historical data.
| Index | Per year | ₹1 lakh became | Biggest fall | 1-yr SIP in loss | 5-yr SIP in loss |
|---|---|---|---|---|---|
| Nifty 50 | 11.9% | ₹5.14 L | −29.1% | 18% | 1% |
| Nifty 500 | 13.3% | ₹6.22 L | −28.9% | 23% | 2% |
| Midcap 150 | 18.0% | ₹11.21 L | −37.3% | 18% | 3% |
| Smallcap 250 | 16.0% | ₹8.72 L | −54.6% | 30% | 11% |
Three things stand out. Short SIPs lose money often. About 1 in 5 one-year Nifty 50 SIPs ended in a loss, but only 1 of 116 five-year SIPs did, and no seven-year SIP did. Smaller companies paid more but fell much harder. Smallcap 250 lost 54.6% from December 2017 to March 2020 and took 13 months after the bottom to get back. Falls are normal. Nifty 50 had five month-end falls of 10% or more in this period. It still went up in 13 of 15 calendar years (2026 is so far).
How to read each section
Key numbers show what ₹1 lakh invested at the start became, the yearly return (CAGR), this year so far, and the biggest fall. How far below its high shows every fall as a valley: 0% means the index was at a new high that month. The table under it lists each fall of 10% or more, how long it kept falling, and how long it took to get back to the old high. Year by year shows calendar-year returns, December to December. Rolling returns show the yearly return for every possible 1, 3, 5, 7 or 10-year period, so you see the best, worst and usual outcome instead of one lucky start date. SIP check runs a monthly SIP from every possible start month and counts how many ended below the money put in.
What this page doesn't tell you
Day-to-day falls were deeper
We use month-end values. In March 2020 Nifty 50 fell about 38% from top to bottom during the month, but the month-end numbers show 29%.
Index funds cost a little
A real index fund charges a yearly fee (0.1–0.5%) and trails the index slightly. TRI has no fees.
Only since 2012
The 2008 crash (Nifty 50 fell more than 50%) is not in this data. Long periods with no gain have happened before 2012.
No tax
Returns are before tax. Equity gains above ₹1.25 lakh a year are taxed at 12.5% after one year, 20% before.
Why look at Nifty history this way?
What's wrong with the usual "Nifty gave X% a year"?
Most sites quote one number: the Nifty 50 price return between two dates. That number changes a lot with the dates you pick, and it leaves out dividends. From February 2012 to September 2026 the Nifty 50 TRI grew 11.9% a year, but a person who started in January 2025 had 0% after 21 months. Both are true. One number can't tell you how bumpy the road was, how often investors were in a loss, or how long recoveries took. This page shows all of that side by side.
Where does the data come from, and how is it calculated?
We use the month-end Total Return Index (TRI) values published by Nifty Indices, the NSE company that runs every Nifty index. TRI assumes each dividend is put back into the index, which is how mutual funds are measured under SEBI rules (funds must compare themselves with a TRI benchmark). Every number on the page is worked out in your browser from those 176 month-end values per index: CAGR, falls, rolling returns and SIP results all use the same data.
What happens to a SIP when the market falls?
The SIP check runs a monthly SIP from every possible start month and counts how many ended below the money put in. For Nifty 50, 30 of 164 one-year SIPs (18%) ended in a loss, but only 1 of 116 five-year SIPs did, and none of seven years or longer. The red bars in the chart show exactly which start months were unlucky: mostly SIPs that ended near the March 2020 bottom or the 2026 fall.
How did the Nifty do in past crashes?
Using month-end values, Nifty 50 fell 20.6% from February 2015 to February 2016 and 29.1% from December 2019 to March 2020, and was back at its old high 6 and 8 months after the bottom. Smaller companies fell much harder: Smallcap 250 lost 54.6% from December 2017 to March 2020, and Nifty Auto lost 59.2%. The fall that started in November 2025 took Nifty 50 down 14.7% by March 2026.
What can you do with it?
Pick up to three of 12 indices (Nifty 50, Nifty 500, Midcap 150, Smallcap 250, Bank, IT, Pharma, Auto, FMCG, Metal, Realty and Energy), set the years, and compare. Every chart has a download button for a 9:16 image (Reels, Shorts) or a 16:9 image (YouTube, slides). The page link remembers your picks, so you can share an exact view. To see how a mutual fund did against these indices, use the Mutual Fund Backtester.
What the data shows: four examples
₹1 lakh became ₹5.14 lakh through five falls of 10% or more. It went up in 13 of 15 calendar years; the down years were 2015 (−3.0%) and 2026 so far (−10.6%).
The best of the 12 indices: ₹1 lakh became ₹11.21 lakh. The price was a 37.3% fall from December 2017 to March 2020.
16.0% a year in the end, but 30% of one-year SIPs and 11% of five-year SIPs ended in a loss: more than any other broad index.
IT fell 24.6% in 2026 alone. Over the full period it still gave 12.6% a year, close to Nifty 50, but with far bigger swings.
Month-end TRI data to September 2026 (part month). Past performance does not guarantee future results.
Frequently asked questions
What is Nifty 50 TRI and how is it different from Nifty 50?
The Nifty 50 you see on the news is a price index: it ignores dividends. The Nifty 50 TRI (Total Return Index) assumes every dividend is put back into the index. Over long periods TRI grows about 1–1.5% a year faster. Index funds and mutual funds are compared against TRI, so it is the fair number to use.
What are the Nifty 50 historical returns since 2012?
From February 2012 to September 2026, Nifty 50 TRI grew 11.9% a year. ₹1 lakh became about ₹5.14 lakh. Over the same period Nifty 500 TRI grew 13.3% a year (₹6.22 lakh), Midcap 150 18.0% (₹11.21 lakh) and Smallcap 250 16.0% (₹8.72 lakh).
How many times has Nifty 50 fallen 20% or more since 2012?
Twice, using month-end values: February 2015 to February 2016 (−20.6%) and December 2019 to March 2020 (−29.1%). It got back to its old high 6 and 8 months after the bottom. In all it had five falls of 10% or more; the latest started in November 2025 and reached −14.7% by March 2026.
How often does a Nifty 50 SIP lose money?
It depends on how long you keep it. 30 of 164 one-year SIPs (18%) ended in a loss, 4 of 140 three-year SIPs (3%), 1 of 116 five-year SIPs, and none of seven years or longer. For Smallcap 250 it was 30% for one year and 11% for five years, so smaller companies need more patience.
In which years did Nifty 50 give a negative return?
Since 2012, Nifty 50 TRI had only one full calendar year with a loss: 2015 (−3.0%). 2026 is down 10.6% so far (January to September). Every other year from 2013 to 2025 was positive; the best was 2014 at +32.9%. Smallcap 250 had five negative years in the same period, including −26.1% in 2018.
What are rolling returns and why are they better than a single return figure?
A rolling return is the yearly return for every possible period of the same length, for example every 5-year window starting each month. Instead of one number that depends on the dates you pick, you see the best, worst and usual result. For Nifty 50, 5-year rolling returns averaged 13.6% a year, with the worst at 1.6% and the best at 23.7%.
Midcap or Smallcap vs Nifty 50: which did better?
Midcap 150 TRI gave the most: 18.0% a year, but it fell 37.3% from December 2017 to March 2020. Smallcap 250 gave 16.0% a year with a 54.6% fall in the same period. Nifty 50 gave 11.9% with a biggest fall of 29.1%. Higher returns came with much deeper and longer falls.
Which Nifty sector index did best since 2012?
Of the eight sectors on this page, Nifty Auto gave the most at 14.9% a year, followed by Pharma (13.3%), Bank and Energy (13.0% each). Nifty Realty gave the least at 9.1% a year and fell 54.6% between January 2013 and February 2016. Sector returns swing far more than Nifty 50 from year to year.
Is the 2025–26 market fall unusual?
Not by itself. Nifty 50 fell 14.7% from November 2025 to March 2026, its fifth fall of 10% or more since 2012. The 2015–16 fall (−20.6%) and the 2020 crash (−29.1%) were deeper. What stands out is the sector split: Nifty IT fell 37.2% from December 2024, while Nifty 500 was only 5% below its high in September 2026.
Why do the falls look smaller than I remember, for example March 2020?
We use month-end values, so a fall that bottoms in the middle of a month shows less. In March 2020 Nifty 50 fell about 38% from top to bottom during the month, but month-end to month-end it shows 29.1%. The direction and timing are right; the exact bottom was deeper than the chart shows.
Can I download the charts for a video or presentation?
Yes. Every chart has two download buttons: 9:16 (1080×1920, for Reels and Shorts) and 16:9 (1920×1080, for YouTube and slides). The image includes a title, the date range and the data source. The page link also remembers which indices and years you picked, so you can share the exact view.
Where does this data come from and how often is it updated?
Month-end TRI values published by Nifty Indices (niftyindices.com), the NSE company that runs the Nifty indices. We update the file about once a month. The latest month is part-month until it ends, so it is marked “(part)” on the page.
Is this tool free? Do I need to sign up?
Yes, it is free and there is no sign-up or login. Everything is calculated in your browser from the published index data. Nothing you pick is stored on our server. It is for learning only and is not investment advice; talk to a SEBI-registered adviser before acting on it.
How to use the Nifty Index History tool
Three steps, under 30 seconds.
1Pick indices and years
Tap up to three indices at the top. Each gets its own colour. Use From and To to choose the years; the key number cards update at once.
2See every fall and recovery
The "How far below its high" chart draws each fall as a valley. The table under it lists every fall of 10% or more, how long it lasted and how long the index took to get back.
3Check how often SIPs lost money
The SIP check shows the share of 1 to 10-year SIPs that ended in a loss, and a chart of every SIP by start month. Use the download buttons to save any chart as an image.

Kuldeep Singh
Personal finance content creator & developer · Deep Money Minds
Kuldeep builds free, data-driven tools for Indian investors and covers SIPs, mutual funds, index investing and financial independence on YouTube. Questions or a data error? Write to kuldeep@deepmoneyminds.com.
Data: Nifty Indices TRI (niftyindices.com), month-end closes. The last month is part-month (date at the top). Falls are measured month-end to month-end, so the real day-to-day falls were deeper (e.g. March 2020). Past returns don't promise future returns.