Investment mode — enter SIP or lumpsum amounts per fund
Start with your first fund
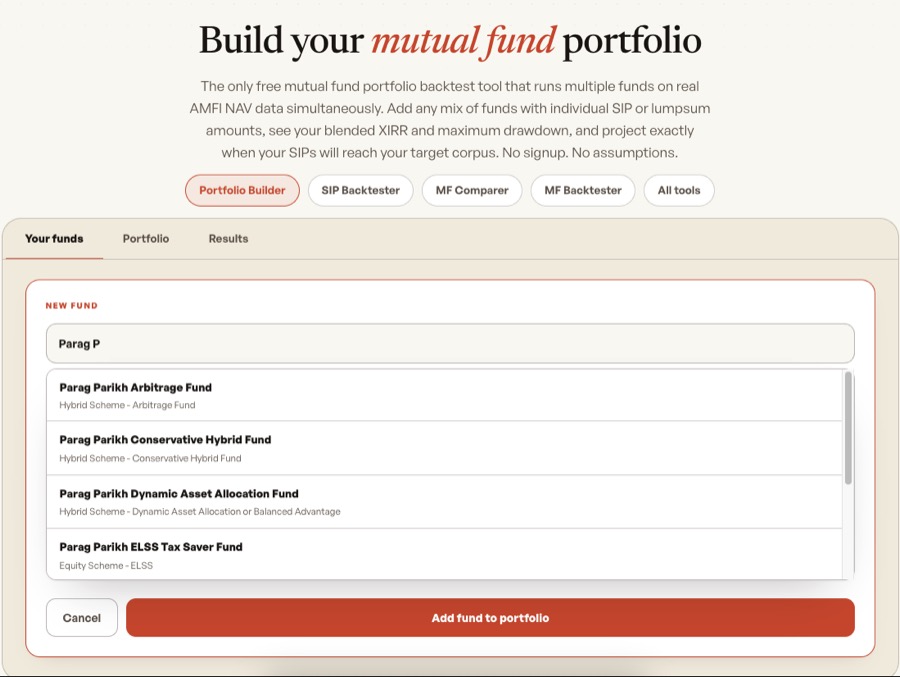
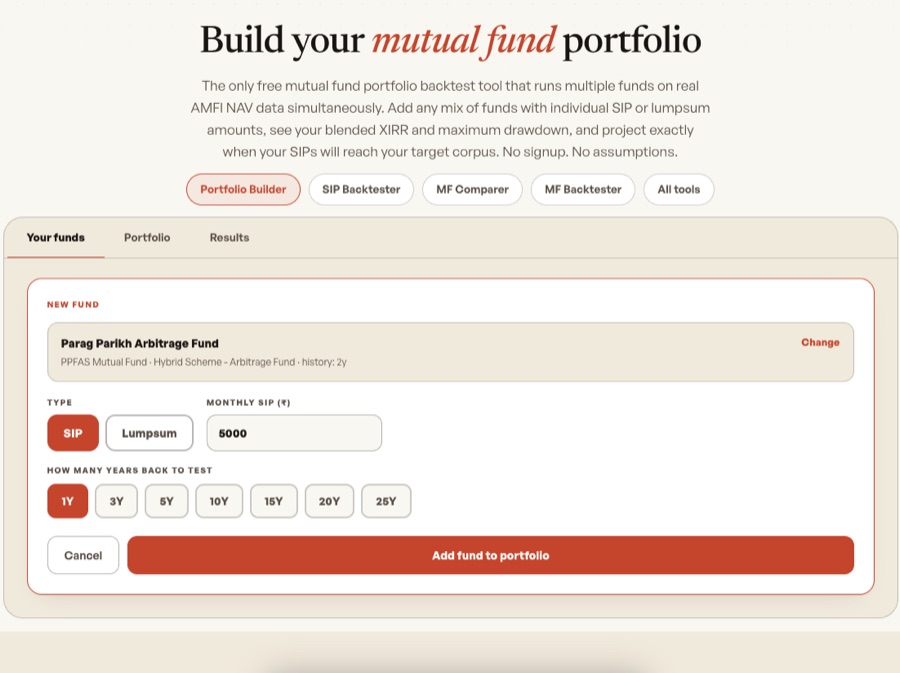
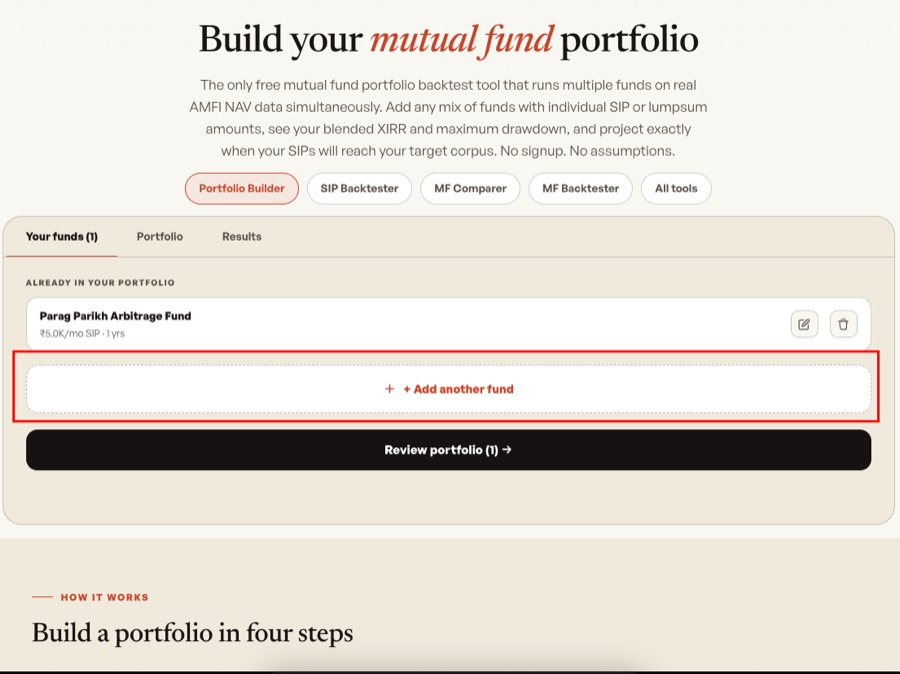
Add a mutual fund, choose SIP or lumpsum, set an amount and how many years back to test. Add more funds any time.
Build a portfolio in four steps
Popular portfolio combos
Click each fund to search and add it — then simulate the full portfolio
PPFAS + Nippon Small Cap
India's most-followed 2-fund portfolio
MO Midcap + SBI Small Cap
High-conviction midcap + disciplined small cap
UTI Nifty 50 + Midcap 150
Pure passive portfolio — broad market + midcap tilt
HDFC MidCap + ICICI Bluechip
Proven midcap track record + stable large cap anchor
PPFAS + UTI Nifty 50 + Nippon Small Cap
Flexi cap core + index + small cap booster
HDFC BAF + PPFAS Flexi Cap
Dynamic allocation + global equity overlay — lower volatility
Why backtest your mutual fund portfolio?
Most SIP calculators assume returns that never happen
A standard SIP calculator asks you to type in an expected return — say 12% — and computes a perfectly smooth growth curve to your goal. That 12% never actually arrives in straight lines. The Nifty 50 fell 38% in 2008 and 23% in March 2020, then rallied sharply in both cases. A flat-rate calculator hides all of that. A backtest on real AMFI NAV data shows you the actual journey — the dips, the recoveries, the sideways years — and what your XIRR really was after living through them.
What blended XIRR actually reveals about your portfolio
When you hold multiple funds, averaging their individual XIRRs gives you a misleading number. If your PPFAS Flexi Cap has a 17% XIRR on ₹5,000/month but your Nippon Small Cap has a 22% XIRR on ₹2,000/month, a simple average of 19.5% overstates the result — you put more money into the lower-returning fund. Blended XIRR pools every SIP outflow from every fund into one cash-flow schedule and solves for the single rate that makes the combined investment balance out. That number — the one a SEBI-registered adviser would report — is what this tool computes.
Where the data comes from
Every NAV in this tool comes from AMFI (Association of Mutual Funds in India) — the official regulatory body that publishes daily NAV data for every registered scheme. We keep the full daily NAV history of every live plan in our own database, updated daily from AMFI; the few plans missing from it are fetched from mfapi.in, an open API that mirrors the official AMFI records. No estimated returns. No smoothed data. No backfilled NAVs. The prices you backtest on are the same ones SEBI-regulated platforms use.
Test how your portfolio held up through real crashes
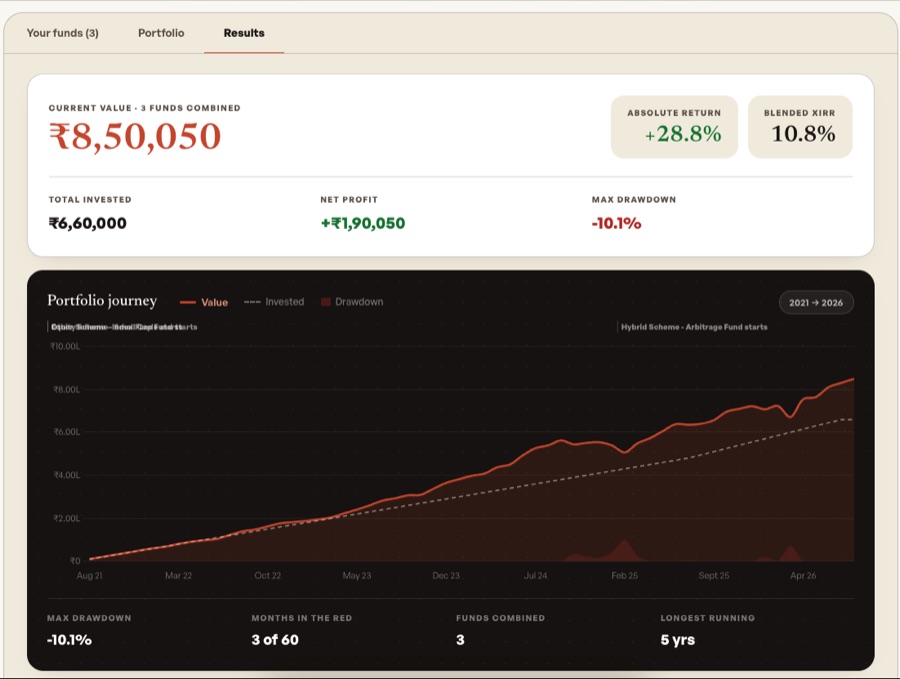
The maximum drawdown figure tells you how far your combined portfolio fell from its peak before recovering — expressed as a percentage. A 5-year backtest of any India equity portfolio covers the COVID crash of March 2020 (Nifty 50 fell ~38% in 40 days). A 15-year backtest covers the 2008–09 global financial crisis (Nifty 50 fell over 60% from peak). The portfolio value chart lets you see exactly when these drops hit your specific fund mix and whether the recovery timeline would have tested your conviction. That context is what helps you decide how much equity risk is right for you.
What you can build and test with this tool
This tool supports any combination of SIP and lumpsum investments across any of 8,700+ live AMFI-registered mutual fund plans. You can build a classic 2-fund portfolio (flexi cap + small cap), a 3-fund index portfolio (large + mid + small), a hybrid + equity split, or an asymmetric portfolio where each fund gets a different monthly amount. Each fund can have a different backtest duration — so you can model the portfolio as it was actually built over time, not as a hypothetical started on one day. Set a target corpus and the forward projection shows when you'll cross it.
Mutual fund portfolio backtest, answered
What is a mutual fund portfolio backtest?
A mutual fund portfolio backtest replays your exact investment plan using real historical NAV data from AMFI — the official mutual fund regulator in India. Instead of assuming a flat 12% or 15% return, it shows your actual month-by-month portfolio journey including market crashes, recoveries, and bull runs. You see your true XIRR, how far the portfolio fell at its worst (maximum drawdown), and how long the recovery took.
How do I backtest multiple mutual funds together in India?
Search for each fund by name, pick SIP or lumpsum, set the amount and test duration, then click 'Add to portfolio'. Repeat for every fund. Once all funds are added, click 'Simulate portfolio'. The tool replays real AMFI NAV history for each fund on a shared timeline and combines them into one blended portfolio view — showing a single XIRR, drawdown chart, and per-fund breakdown. No spreadsheet needed.
What is blended XIRR and how is it different from averaging each fund's XIRR?
Blended XIRR treats your entire portfolio as one investment: every SIP and lumpsum from every fund is merged into a single cash-flow schedule, and we solve for the one annualized rate that balances those inflows against today's combined value. Averaging each fund's XIRR ignores position sizing — a 24% XIRR fund where you invest ₹500/month barely moves the needle if a 12% XIRR fund is getting ₹10,000/month. Blended XIRR gives you the true weighted outcome, the same number a SEBI-registered adviser would use.
What is portfolio drawdown and how is it calculated?
Maximum drawdown is the largest peak-to-trough decline in your combined portfolio value during the backtest period. If the portfolio grew to ₹10 lakh then fell to ₹7 lakh before recovering, the maximum drawdown is 30%. The results chart plots portfolio value month by month so you can see exactly when drops happened — useful for understanding how your portfolio would have fared during events like March 2020 or the 2008 global financial crisis.
Can I backtest Parag Parikh Flexi Cap along with Nippon Small Cap in one portfolio?
Yes — search for 'Parag Parikh Flexi Cap', set your SIP amount and duration, add it to the portfolio, then search for 'Nippon India Small Cap' and add that too. Simulate and you'll see a combined XIRR for the two-fund portfolio, the blended drawdown chart, and a per-fund breakdown. This is the most popular use case: testing India's favourite two-fund or three-fund portfolio combinations side by side.
How does a mutual fund portfolio backtest differ from a flat-rate SIP calculator?
A flat-rate SIP calculator assumes a constant return — usually 12% or 15% — every month. It tells you where you'd end up if markets went up in a perfectly straight line, which never happens. This tool replays real month-by-month NAV prices from AMFI, so the results include actual market crashes, sideways periods, and bull runs. The XIRR you see is what genuinely happened to that investment, not a smooth projection based on an assumed rate.
Why does each fund in my portfolio get its own duration?
Real portfolios are built over time. You might have started a Nifty 50 index fund 15 years ago and added a small-cap fund 3 years ago. This tool honours that by letting each fund have its own start date on a shared timeline that ends today. A 15-year test starts around 2011 and a 3-year test starts around 2023, but both end at the same current date — you see staggered entry lines on the chart, exactly as your actual portfolio would look.
What if a fund hasn't existed as long as the period I pick?
The tool automatically caps the backtest to the fund's full available NAV history from AMFI and shows a notice explaining the actual test duration. No broken math, no missing-data gaps — you get all the history that exists for that fund, clearly labelled.
What's the difference between SIP and lumpsum in this tool?
SIP simulates a fixed monthly investment — for example ₹5,000 every month, purchased at that month's closing NAV, for the full duration you set. Lumpsum simulates a single one-time investment made at the NAV on the first day of the test period. You can mix both in the same portfolio: a monthly SIP in one fund and a lumpsum in another.
How is XIRR calculated across the whole portfolio?
Every outflow from every fund (SIP payments and lumpsum investments) is merged into one cash-flow list sorted by date — all as negative values. Today's combined portfolio value is the single positive terminal cash flow. We then use a bisection algorithm to find the annualized discount rate that makes the Net Present Value of that combined flow equal to zero. This is the same XIRR method used by SEBI-registered advisers and mutual fund fact sheets.
What does the forward projection assume?
The projection assumes your current SIPs continue at today's same amounts and the blended historical XIRR rate remains constant going forward. It compounds your existing corpus at that rate while adding monthly SIPs, then shows when you'll cross the target corpus you entered. This is a simplification for rough planning — future returns will differ from historical returns. Always treat it as a directional estimate, not a guarantee.
Where does the NAV data come from?
NAV history is sourced from AMFI (Association of Mutual Funds in India) — the official regulatory body that publishes daily NAV data for every registered mutual fund scheme. We keep the full daily NAV history of every live plan in our own database, updated daily from AMFI; the few plans missing from it are fetched from mfapi.in, an open API that mirrors official AMFI records. You are always backtesting against real, regulatory-grade prices, not estimates or sampled data.
Is this tool free? Do I need to create an account?
This tool is completely free to use. There is no account required, no email sign-up, and no paywall of any kind. All calculations run entirely in your browser using NAV data fetched live from AMFI. Your portfolio inputs are never sent to or stored on any server.

Kuldeep Singh
Personal finance writer & developer
Builds free investment tools for Indian investors and writes about ETFs, mutual funds, SIP strategy and XIRR analysis on Deep Money Minds.