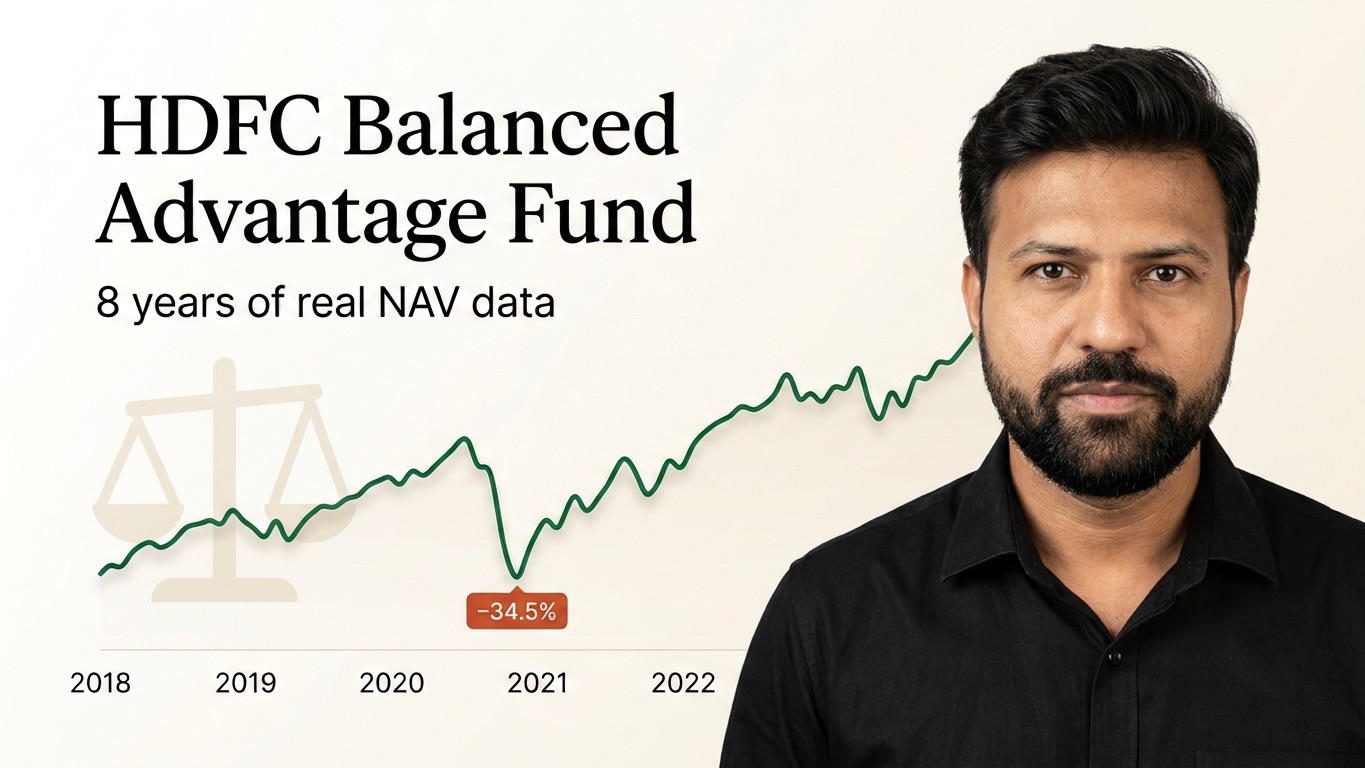
HDFC Balanced Advantage Fund review: what 8 years of real NAV data show
SIP, lumpsum, crashes, monthly IDCW, SWP, tax and fees for India's ₹1.07 lakh crore hybrid fund, and how it compares with ICICI's, measured only from June 2018, when it became a balanced advantage fund.
Since June 2018, a ₹5,000 monthly SIP in it returned 13.48% a year in Regular Growth and 14.20% in Direct, ahead of ICICI's balanced advantage fund. But it fell 34.5% in 2019–20, its SIP return over the last three years is only 1.79% a year, and the ₹0.25 monthly IDCW has been cut before. It suits 5+ year money that can sit through a 30% fall. Direct Growth is the cheaper pick.
"
Bhai, Balanced Advantage le lo. Market gire ya chadhe, yeh fund khud sambhal leta hai.
That's the pitch, and ₹1.07 lakh crore of investor money has bought it. So I checked what happened when the market actually fell. By the Covid crash, this fund had fallen 34.5%.
It gets stranger. Start a ₹5,000 SIP three years ago, and your ₹1.8 lakh is worth about ₹1.85 lakh today. Start it in 2018, and the same SIP grew 13.48% a year. Same fund. Very different results.
₹5L
Invested · ₹5,000/mo since Jun 2018
₹8.90L
Value today · Regular Growth
13.48%
SIP XIRR · Regular Growth
Direct Growth: ₹9,18,630 at 14.20% XIRR. NAV data as of 1 Oct 2026.
Read this first
This has been a balanced advantage fund only since 2018
In June 2018, HDFC Prudence Fund was merged into HDFC Growth Fund, and the merged fund was renamed HDFC Balanced Advantage Fund. Our NAV series follows the old HDFC Growth Fund, which was a pure equity fund.
Before Jun 2018
HDFC Growth Fund
A pure equity fund. Numbers from this period are tagged Old fund in every table below.
From Jun 2018
HDFC Balanced Advantage Fund
The fund you'd be buying today. All headline numbers in this post come from this period only.
Why HDFC's numbers look different — HDFC's "since inception" returns use the Prudence Fund history from 1994, so they won't match ours.
The plans
Four plans, one portfolio
Every plan holds the same stocks and bonds. They differ in two things: whether a distributor's commission is built in (Regular vs Direct), and whether profits stay invested or get paid out monthly (Growth vs IDCW).
Reg Growth
Reg IDCW
Dir Growth
Dir IDCW
AMFI code
100119
100120
118968
118969
Data from
Apr 2006
Apr 2006
Jan 2013
Jan 2013
NAV
₹501.82
₹34.32
₹546.11
₹40.96
TER (base TER)
1.28% (1.08%)
1.28%
0.76% (0.63%)
0.76%
NAV as of 1 Oct 2026. TER as of 31 Aug 2026.
+0.52%
Extra yearly cost of Regular over Direct (TER, 31 Aug 2026)
₹1,07,295.79 Cr
AUM (HDFC MF, 31 Aug 2026)
The headline
Since June 2018, in one table
Only the balanced advantage years. A ₹5,000 monthly SIP and a ₹1,00,000 lumpsum, both started in June 2018.
Regular Growth
Direct Growth
₹5,000 SIP · ₹5,00,000 invested became
₹8,90,325 XIRR 13.48%
₹9,18,630 XIRR 14.20%
₹1,00,000 lumpsum became
₹2,74,566 CAGR 12.88%
₹2,89,921 CAGR 13.62%
Fund's biggest fall 2019–20, deepened by the Covid crash
−34.5%
−34.2%
Beta / alpha vs Nifty 50 TRI, not the official benchmark
0.79 / +3.0%
0.79 / +3.7%
Sharpe / volatility
0.52 / 14.8%
0.57 / 14.8%
As of 1 Oct 2026. Source: DeepMoneyMinds MF Backtester. The official benchmark is the NIFTY 50 Hybrid Composite Debt 50:50 Index; we don't have its data, so beta and alpha are measured against Nifty 50 TRI.
IDCW vs Growth
Before tax, which one looks better depends on when you invested. After tax, Growth wins.
SIP since Jun 2018, XIRR
Reg IDCW / Reg Growth13.87% / 13.48%
Dir IDCW / Dir Growth14.52% / 14.20%
Lumpsum since Jun 2018, XIRR
Reg IDCW / Reg Growth11.95% / 12.88%
Dir IDCW / Dir Growth12.76% / 13.62%
In the SIP, IDCW comes out ahead. In the lumpsum, Growth does. IDCW figures here are before income tax, with lumpsum payouts taken as cash.
With payouts reinvested, Regular IDCW grew 12.46% a year against 12.88% for Growth. That gap is the dividend distribution tax IDCW holders paid from 2018 to 2020, before their own income tax.
The SIP
₹5,000 a month, by period
SIP on the 5th of every month. The longer windows look good. The last three years do not: ₹1.8 lakh invested became only about ₹1.85 lakh.
XIRR
Reg Growth
Reg IDCW
Dir Growth
Dir IDCW
3 years
1.79%
2.06%
2.40%
2.63%
5 years
9.42%
10.03%
10.11%
10.64%
Since Jun 2018
13.48%
13.87%
14.20%
14.52%
10 years Old fund
13.17%
13.17%
13.89%
13.86%
Full history Old fund
12.93%
—
14.04%
—
As of 1 Oct 2026. 10-year window starts Oct 2016. Full history: Regular Growth turned ₹12.3L into about ₹55L, mostly during the old equity fund years.
The 10-year SIP in rupees Old fund
Oct 2016 to Sep 2026. Includes about 1.7 years of the old equity fund.
Reg Growth
Reg IDCW
Dir Growth
Dir IDCW
Invested
₹6,00,000
₹6,00,000
₹6,00,000
₹6,00,000
Value of units held
₹11,90,877
₹6,75,769
₹12,37,963
₹7,38,131
XIRR
13.17%
13.17%
13.89%
13.86%
Biggest fall in period
34.49%
34.49%
34.20%
34.20%
As of 1 Oct 2026. IDCW "value of units held" excludes the monthly payouts already received.
Direct ends ₹47,086 ahead
Same fund, same SIP, same dates. Direct Growth beats Regular Growth by ₹47,086 over 10 years.
The SIP date barely matters
Growth plans: best date was the 3rd, worst the 2nd. The difference is only about ₹16,000.
The lumpsum
₹1,00,000 invested once
If you had put in ₹1 lakh a year ago, you'd be slightly down today. From June 2018, it has close to tripled in Direct Growth.
Period
Reg Growth
Reg IDCW
Dir Growth
Dir IDCW
1 year
−3.16%
−3.00%
−2.61%
−2.47%
3 years
9.40%
10.43%
10.05%
10.94%
5 years
12.49%
13.22%
13.18%
13.81%
Since Jun 2018
12.88% (₹2.75L)
11.95%
13.62% (₹2.90L)
12.76%
10 years Old fund
13.01% (₹3.39L)
12.45%
13.75% (₹3.62L)
13.24%
Full history Old fund
12.82% (₹11.86L)
12.65%
13.59% (₹5.76L)
12.75%
As of 1 Oct 2026. Growth figures are CAGR; IDCW figures are XIRR with payouts taken as cash and not reinvested, so they aren't like-for-like with Growth. Direct full history starts Jan 2013.
Year by year
Calendar-year returns
Every full year since 2019 has been positive. 2026 is negative so far.
Growth plans · Regular vs Direct · 2019 to 2026 YTD · as of 1 Oct 2026
Old fund · Regular2008 −48.3%·2009 +75.3%·2011 −21.2%·2014 +42.9%·2017 +35.4%·2018 −0.8% (old fund to May)
The risk
Less bumpy than Nifty, not smooth
A beta of about 0.7 to 0.8 means the fund has moved roughly 70–80% as much as Nifty 50. Its volatility has stayed below the index in every window.
Window
Beta
Alpha (Reg)
R²
Fund vol.
Nifty 50 vol.
Since Jun 2018
0.79 / 0.79
+3.0% (Dir +3.7%)
82%
14.8%
17.0%
3 years
0.72
+2.6%
85%
10.9%
13.9%
5 years
0.71
+5.5%
82%
10.4%
13.4%
10 years Old fund
0.80 / 0.81
+2.1%
82%
14.4%
16.2%
As of 1 Oct 2026. Measured against Nifty 50 TRI, not the official benchmark (NIFTY 50 Hybrid Composite Debt 50:50 Index). Alpha is Jensen's alpha with a 6% risk-free rate. Beta shown as Regular / Direct where both are available.
Rolling returns
No 3-year or 5-year loss since Jun 2018
No 3-year or 5-year holding period in the balanced advantage years has lost money.
This covers only 64 and 40 months of end dates, mostly in a strong market. Treat it as a rough guide.
Direct beats Regular by about 0.7% a year
Comparing Regular and Direct on the same rolling dates, from Jan 2013 when Direct plans began.
The falls
How far it fell, and how long it took to recover
"Balanced" doesn't mean it can't fall. In 2019–20 the fund dropped 34.5% and took 15.5 months to get back to its old high.
Right now
−6.9%
Below the all-time high of 2 Jan 2026 (Direct: −6.5%). As of 1 Oct 2026.
Fall
Lowest
Back to high
Wait
2026
−10.3%
Not yet
8.9 mo so far
2019–20
−34.5%
Dec 2020
15.5 mo
2018 Old fund
−11.9%
Mar 2019
~1 yr
2015–16 Old fund
−21.9%
Jul 2016
~1 yr 2 mo
2008 Old fund
−58.9%
Jul 2010
~2 yr 6 mo
Regular Growth, as of 1 Oct 2026. The 2026 fall peaked on 2 Jan 2026 and first hit −10% on 30 Mar 2026: 6.1 months since it hit −10%, 8.9 months since the peak.
Why it's down
Why is HDFC Balanced Advantage Fund falling?
Because the big Indian stocks it holds fell, and about 73% of the fund is in shares with no hedge. It has still fallen less than Nifty 50.
−4.9%
Nifty 50 TRI
−2.0%
HDFC BAF, Regular Growth
+2.1%
ICICI Pru BAF, Regular Growth
End-Sep 2025 to end-Sep 2026
01
Its biggest holdings fell
HDFC Bank (4.13% of the fund) is down 24.0% in a year, Reliance (3.74%) 13.9%, Bharti Airtel 6.9%, NTPC 5.1% and ICICI Bank 4.2%. Banks are the biggest sector, at about 19%.
02
A lot of equity for a 'balanced' fund
Shares are 73.3% of the fund (74.6% with REITs), and the Aug 2026 factsheet shows no equity hedges. When large caps fall, most of the fund falls with them.
03
Falls like this are normal for it
The 2026 fall reached −10.3% at its worst, on 30 Mar 2026. In 2019–20 it fell 34.5%. A fund that moves 70–80% as much as Nifty will fall when Nifty does, just by less.
Fund and index changes use month-end values. Holdings as of 31 Aug 2026; stock figures are 1-year price returns.
The payout
The monthly IDCW is not fixed
The payout per unit has changed four times since June 2018, including a 26% cut after Covid. It is not guaranteed, and it can be cut again.
Monthly payout per unit · same for Regular and Direct · record dates Jun 2018 to 25 Sep 2026
Period
Months
Per unit / month
Per unit, total
Jun 2018 – Mar 2020
22
₹0.31
₹6.82
Apr 2020 – Sep 2021
18
₹0.23 26% cut after Covid
₹4.14
Oct 2021 – Mar 2023
18
₹0.26
₹4.68
Apr 2023 – Nov 2023
8
₹0.23
₹1.84
Dec 2023 – Sep 2026
34
₹0.25
₹8.50
Total
100
₹25.98
Record dates up to 25 Sep 2026. This is the cash investors received.
01
The yield keeps falling
The payout per unit has stayed roughly flat while the NAV grew, so the payout as a share of NAV keeps shrinking. Regular plan, yearly payout as % of NAV:
2019
13.3%
2020
13.6%
2025
7.75%
2026 so far
6.1%
02
Today's ₹0.25 is under 1% of NAV a month
0.73% of the Regular IDCW NAV (₹34.32) and 0.61% of the Direct IDCW NAV (₹40.96), as of 1 Oct 2026. On the 10-year SIP, Regular IDCW holds 19,690 units: 19,690 × ₹0.25 = about ₹4,922 for the Sep 2026 payout.
03
Until March 2020, tax came out first
A dividend distribution tax of about 11.65% was taken out of the NAV before investors were paid. The NAV fell by about ₹0.35, and investors received ₹0.31.
04
Before June 2018, it paid once a year Old fund
The old equity fund made one payout a year, about 9–12% of NAV.
The SWP
Using it for a monthly income (SWP)
An SWP (systematic withdrawal plan) sells a fixed rupee amount of units every month, so you choose the income instead of waiting for HDFC's IDCW. We tested ₹10 lakh in Regular Growth, withdrawing on the 5th of every month from the month after investing.
Value left on 1 Oct 2026 from ₹10 lakh
Started
₹6,000/mo 7.2% a year
₹8,000/mo 9.6% a year
₹10,000/mo 12% a year
Jun 2018 · 99 withdrawals
₹16.94L
₹13.43L
₹9.93L
Oct 2021 · 59 withdrawals
₹13.55L
₹12.07L
₹10.59L
Oct 2023 · 35 withdrawals
₹10.95L
₹10.23L
₹9.52L
₹8,000 a month since 2018
₹7.92 lakh taken out and ₹13.43 lakh still left. The low point was ₹6.90 lakh on a withdrawal date, right after the Covid crash.
₹10,000 a month since 2023
₹3.5 lakh taken out, but only ₹9.52 lakh left: below the ₹10 lakh you started with. A 12% withdrawal rate needs a strong market.
Before tax. Direct Growth leaves more (₹14.53 lakh at ₹8,000 a month since June 2018). Up to 15% of units can be sold in the first year without exit load, which covers these withdrawal sizes.
For tax, it counts as an equity-oriented fund, because more than 65% is in Indian shares. Growth units (and SWP withdrawals) are taxed like equity. IDCW payouts are taxed as income.
Capital gains
Growth and SWP
Sold within 1 year
20% on the gain
Sold after 1 year
12.5% on gains above ₹1.25 lakh a year
When
Only when you sell, only on the gain
Your income slab
IDCW
Each payout
Added to your income, taxed at your slab (up to 30% + cess)
TDS
10% once payouts from the scheme cross ₹10,000 in a year
When
Every month, even when the fund falls
Example: the 10-year Regular IDCW SIP in this review received about ₹4,922 in September 2026 alone. In the 30% slab that is about ₹1,536 in tax (31.2% with cess) every month. A Growth investor using an SWP pays tax only on the gain part of each withdrawal, and nothing on the first ₹1.25 lakh of long-term gains each year.
Current rules for resident individuals (Oct 2026). Tax rules change; check your own case with a tax adviser.
On the same 10-year ₹5,000 SIP, Regular Growth paid ₹14,274 in fees over the last 12 months. Direct Growth paid ₹8,804.
Reg Growth
₹14,274
Last 12 months · ₹1,323 in Sep
Reg IDCW
₹8,314
Last 12 months · ₹756 in Sep
Dir Growth
₹8,804
Last 12 months · ₹817 in Sep
Dir IDCW
₹5,365
Last 12 months · ₹490 in Sep
10-year ₹5,000 SIP, as of Sep 2026. IDCW fees are lower because payouts shrink the amount still invested.
The portfolio
What the fund holds
Mostly large-cap stocks, with banks as the biggest sector at about 19%. The top 10 holdings make up 30.43% of the fund.
Large caps53.7%
Mid caps11.0%
Small caps8.6%
AAA bonds12.1%
Govt securities7.1%
Rest7.5%
Equity is 73.3% of the fund (74.6% with REITs). HDFC's Aug 2026 factsheet shows no equity hedges, only a ₹500 Cr interest rate swap on the bond side.
#
Holding
% of fund
1Y stock return
01
ICICI Bank
5.32%
−4.2%
02
HDFC Bank
4.13%
−24.0%
03
Reliance
3.74%
−13.9%
04
SBI
3.46%
+10.8%
05
Bharti Airtel
2.93%
−6.9%
06
Axis Bank
2.68%
+7.1%
07
L&T
2.59%
+1.7%
08
7.18% GOI 2033
1.99%
—
09
NTPC
1.94%
−5.1%
10
Eternal
1.65%
+0.9%
Holdings as of 31 Aug 2026. Top 10 = 30.43% of the fund.
HDFC vs ICICI
HDFC vs ICICI Prudential Balanced Advantage Fund
The two biggest balanced advantage funds, Regular Growth plans, on the same dates. HDFC earned more since 2018. ICICI fell less, and did better over the last three years.
HDFC BAF
ICICI Pru BAF
AUM (Aug 2026)
₹1,07,296 Cr
~₹75,400 Cr*
₹5,000 SIP since Jun 2018
₹8,90,325 · 13.48%
₹7,77,769 · 10.36%
₹1 lakh lumpsum since Jun 2018
₹2,74,566 · 12.88%
₹2,26,171 · 10.28%
SIP, last 3 years (XIRR)
1.79%
5.20%
1 year
−3.16%
+1.00%
Biggest fall since Jun 2018
−34.5%
−27.1%
Worst point of the 2026 fall
−10.3%
−8.3%
TER, Regular / Direct
1.28% / 0.76%
1.54% / 1.04%
HDFC returned about 3 points a year more on the SIP since 2018, and costs less. But it fell deeper every time the market fell. ICICI's fund was the smoother ride. Choose by how big a fall you can sit through, not by the brand.
As of 1 Oct 2026. NAVs from AMFI via our NAV database; SIP on the 5th of each month. Direct Growth SIP since Jun 2018: HDFC 14.20%, ICICI 11.04%. TER from AMFI, 31 Aug 2026. *ICICI AUM worked out from its Aug 2026 holdings.
It falls less than Nifty. It still falls, and the payout isn't fixed.
Since June 2018, a ₹5,000 SIP earned 13.48% a year in Regular Growth and 14.20% in Direct, with a beta of 0.79 against Nifty 50 TRI. It also fell 34.5% in 2019–20 and has had a weak last three years. If you invest, Direct Growth costs less, and after tax, Growth beats IDCW.
★★★★★3/5· Rated by Kuldeep Singh
Strong long-run returns and lower cost than ICICI, but 73% in shares with no hedge, a 34.5% fall in 2020, a weak last three years, and a monthly payout that isn't fixed.
Good fit if you
✓are investing for 5+ years and can sit through a 30% fall without selling
✓want one fund that mixes shares and debt, and don't want to rebalance yourself
✓are in a high tax slab and want monthly income: pick Direct Growth + SWP, not IDCW
Skip it if you
✕need the money within 3 years (SIP return over the last 3 years: 1.79% a year)
✕expect FD-like safety. “Balanced” here still means about 73% in shares
✕need a fixed monthly income. The IDCW has been changed 4 times since 2018 and can be cut
✕already hold large-cap funds. Its top holdings (ICICI Bank, HDFC Bank, Reliance, Airtel) are probably already in your portfolio
It has done well over the long run: since June 2018, a ₹5,000 SIP returned 13.48% a year in Regular Growth and 14.20% in Direct, ahead of ICICI's balanced advantage fund (10.36%). But it fell 34.5% in 2019–20 and its SIP return over the last three years is only 1.79% a year. It suits 5+ year money that can sit through a 30% fall.
Does HDFC Balanced Advantage Fund give monthly dividends?
+
Yes, the IDCW option pays monthly, but the amount is not fixed. It has changed four times since June 2018: ₹0.31, ₹0.23, ₹0.26, ₹0.23 and now ₹0.25 per unit. Today ₹0.25 is under 1% of the IDCW NAV a month. Payouts are not guaranteed and can be cut.
What is the IDCW dividend history of HDFC Balanced Advantage Fund?
+
₹0.31 per unit a month from Jun 2018 to Mar 2020, ₹0.23 from Apr 2020 to Sep 2021 (a 26% cut after Covid), ₹0.26 from Oct 2021 to Mar 2023, ₹0.23 from Apr to Nov 2023, and ₹0.25 from Dec 2023 to Sep 2026. That is ₹25.98 per unit over 100 months, the same for Regular and Direct.
Should I pick IDCW or Growth?
+
Before tax, which one looks better depends on when you invested: IDCW came out ahead on the SIP since 2018, Growth on the lumpsum. After tax, Growth wins for most people, because IDCW payouts are taxed at your slab every month, while Growth gains are taxed at 12.5% only when you sell, above ₹1.25 lakh a year.
How is HDFC Balanced Advantage Fund taxed?
+
It is taxed as an equity-oriented fund. Growth units sold within a year pay 20% on the gain; after a year, 12.5% on gains above ₹1.25 lakh a year. IDCW payouts are added to your income and taxed at your slab rate, with 10% TDS once payouts from the scheme cross ₹10,000 in a financial year.
Why is HDFC Balanced Advantage Fund falling?
+
Because large Indian stocks fell and about 73% of the fund is in unhedged shares. HDFC Bank, its second-biggest holding, is down 24% in a year and Reliance 13.9%. From end-Sep 2025 to end-Sep 2026 the fund fell 2.0% while Nifty 50 TRI fell 4.9%, so it has still fallen less than the market.
What is the 5-year return of HDFC Balanced Advantage Fund?
+
As of 1 Oct 2026, a ₹1 lakh lumpsum made 12.49% a year over 5 years in Regular Growth and 13.18% in Direct Growth. A ₹5,000 monthly SIP over the same 5 years made 9.42% a year in Regular Growth and 10.11% in Direct, because the last three years were weak.
Is it safe to invest in HDFC Balanced Advantage Fund?
+
It is not safe in the way an FD is. It fell 34.5% in 2019–20 and took 15.5 months to recover, and it was 6.9% below its January 2026 high on 1 Oct 2026. It is less volatile than Nifty 50, and no 3-year or 5-year holding since June 2018 has lost money, but that is a short history.
HDFC or ICICI balanced advantage fund: which is better?
+
Since June 2018, HDFC's fund did better: a ₹5,000 SIP made 13.48% a year against 10.36% for ICICI Prudential's, and HDFC's TER is lower. But ICICI's fund fell less (27.1% vs 34.5% in 2020) and did better over the last three years. HDFC suits investors who can take bigger falls.
Is HDFC Balanced Advantage Fund good for SWP?
+
₹10 lakh in Regular Growth from June 2018 with ₹8,000 a month withdrawn still had ₹13.43 lakh on 1 Oct 2026, after paying out ₹7.92 lakh. Started in October 2023, ₹10,000 a month left only ₹9.52 lakh. An SWP of 6–8% a year has held up; 12% a year only works in strong markets.
Is there a lock-in period or exit load?
+
There is no lock-in. Up to 15% of the units from each purchase can be sold within a year without any charge. Units above that pay a 1% exit load if sold within one year of purchase. After one year there is no exit load, as per the scheme information document.
Why don't these returns match HDFC's "since inception" figure?
+
HDFC uses the Prudence Fund history from 1994. Our NAV series follows the old HDFC Growth Fund, a pure equity fund that became this fund in June 2018 when Prudence was merged into it. Our headline numbers use only the period from June 2018, so they measure the fund you would buy today.
What benchmark is the risk data measured against?
+
Nifty 50 TRI (total return index, with dividends reinvested). The fund's official benchmark is the NIFTY 50 Hybrid Composite Debt 50:50 Index, which we don't have data for, so beta and alpha here compare the fund with the main large-cap stock index instead.
How much more does the Regular plan cost?
+
Regular costs 0.52% a year more in TER (1.28% vs 0.76%, as of 31 Aug 2026). That is the distributor commission. On rolling returns from Jan 2013, Direct has beaten Regular by about 0.7% a year, and on the 10-year ₹5,000 SIP, Direct Growth ended ₹47,086 ahead.
This is a data review, not investment advice. Past returns do not guarantee future returns. Mutual fund investments are subject to market risks; read all scheme-related documents carefully.
Since June 2018, a ₹5,000 monthly SIP in it returned 13.48% a year in Regular Growth and 14.20% in Direct, ahead of ICICI's balanced advantage fund. But it fell 34.5% in 2019–20, its SIP return over the last three years is only 1.79% a year, and the ₹0.25 monthly IDCW has been cut before. It suits 5+ year money that can sit through a 30% fall. Direct Growth is the cheaper pick.
"Bhai, Balanced Advantage le lo. Market gire ya chadhe, yeh fund khud sambhal leta hai."
That's the pitch, and ₹1.07 lakh crore of investor money has bought it. But by the Covid crash, this fund had fallen 34.5%.
A SIP started three years ago turned ₹1.8 lakh into about ₹1.85 lakh. The same SIP started in 2018 grew 13.48% a year. Same fund. Very different results.
₹5L
Invested · ₹5,000/mo since Jun 2018
₹8.90L
Value today · Regular Growth
SIP XIRR
Regular Growth
13.48%
Direct Growth: ₹9,18,630 at 14.20%. As of 1 Oct 2026.
Read this first
A balanced advantage fund only since 2018
In June 2018, HDFC Prudence Fund was merged into HDFC Growth Fund, and the merged fund was renamed HDFC Balanced Advantage Fund. Our NAV series follows the old HDFC Growth Fund, a pure equity fund.
Before Jun 2018
HDFC Growth Fund
Pure equity. Tagged Old fund below.
From Jun 2018
HDFC Balanced Advantage Fund
The fund you'd buy today. All headline numbers use this period only.
Why HDFC's numbers differ — its "since inception" returns use the Prudence Fund history from 1994.
The plans
Four plans, one portfolio
Same holdings. Regular includes a distributor's commission; IDCW pays out monthly.
Growth plans, as of 1 Oct 2026. *vs Nifty 50 TRI, not the official benchmark (NIFTY 50 Hybrid Composite Debt 50:50 Index).
IDCW vs Growth
Before tax, which one looks better depends on when you invested. After tax, Growth wins.
SIP since Jun 2018 · IDCW / Growth
Regular13.87% / 13.48%
Direct14.52% / 14.20%
Lumpsum since Jun 2018 · IDCW / Growth
Regular11.95% / 12.88%
Direct12.76% / 13.62%
IDCW before income tax; lumpsum payouts taken as cash. With payouts reinvested, Regular IDCW grew 12.46% a year vs 12.88% for Growth. The gap is the dividend distribution tax paid from 2018 to 2020.
The SIP
₹5,000 a month, by period
SIP on the 5th. The last three years were weak: ₹1.8 lakh became only about ₹1.85 lakh.
XIRRGrowthIDCW
3 years1.79%2.06%
5 years9.42%10.03%
Since Jun 201813.48%13.87%
10 yearsOld fund13.17%13.17%
Full historyOld fund12.93%—
3 years2.40%2.63%
5 years10.11%10.64%
Since Jun 201814.20%14.52%
10 yearsOld fund13.89%13.86%
Full historyOld fund14.04%—
As of 1 Oct 2026. 10 years from Oct 2016. Full history: Regular Growth turned ₹12.3L into about ₹55L, mostly the old equity fund.
10-year SIP in rupees
Oct 2016 – Sep 2026. Includes about 1.7 years of the Old fund
RegularDirectGrowthIDCW
Invested₹6,00,000₹6,00,000
Value of units₹11,90,877₹6,75,769
XIRR13.17%13.17%
Biggest fall34.49%34.49%
Invested₹6,00,000₹6,00,000
Value of units₹12,37,963₹7,38,131
XIRR13.89%13.86%
Biggest fall34.20%34.20%
As of 1 Oct 2026. IDCW value excludes payouts already received.
Direct ends ₹47,086 ahead
Same SIP, same dates, Growth plans, over 10 years.
The SIP date barely matters
Best date the 3rd, worst the 2nd. Only about ₹16,000 apart.
The lumpsum
₹1,00,000 invested once
Slightly down over 1 year. Close to tripled since June 2018 in Direct Growth.
PeriodGrowthIDCW
1 year−3.16% −3.00%
3 years9.40% 10.43%
5 years12.49% 13.22%
Since Jun 201812.88% ₹2.75L11.95%
10 yearsOld fund13.01% ₹3.39L12.45%
Full historyOld fund12.82% ₹11.86L12.65%
1 year−2.61% −2.47%
3 years10.05% 10.94%
5 years13.18% 13.81%
Since Jun 201813.62% ₹2.90L12.76%
10 yearsOld fund13.75% ₹3.62L13.24%
Full historyOld fund13.59% ₹5.76L12.75%
As of 1 Oct 2026. Growth = CAGR. IDCW = XIRR with payouts taken as cash, so not like-for-like with Growth.
Year by year
Calendar-year returns
Every full year since 2019 was positive. 2026 is negative so far.
Beta of 0.7–0.8: it has moved about 70–80% as much as Nifty 50, with lower volatility in every window.
Since Jun 2018
Beta0.79 / 0.79
Alpha (Reg)+3.0% (Dir +3.7%)
R²82%
Fund vol.14.8%
Nifty 50 vol.17.0%
3 years
Beta0.72
Alpha (Reg)+2.6%
R²85%
Fund vol.10.9%
Nifty 50 vol.13.9%
5 years
Beta0.71
Alpha (Reg)+5.5%
R²82%
Fund vol.10.4%
Nifty 50 vol.13.4%
10 yearsOld fund
Beta0.80 / 0.81
Alpha (Reg)+2.1%
R²82%
Fund vol.14.4%
Nifty 50 vol.16.2%
As of 1 Oct 2026. vs Nifty 50 TRI, not the official benchmark (NIFTY 50 Hybrid Composite Debt 50:50). Jensen's alpha, 6% risk-free rate.
Rolling returns
No 3- or 5-year loss since Jun 2018
Only 64 and 40 months of end dates, mostly in a strong market. Treat it as a rough guide.
Direct beats Regular by ~0.7% a year
Same rolling dates, from Jan 2013.
The falls
How far it fell, how long it took
In 2019–20 it dropped 34.5% and needed 15.5 months to recover.
Right now
Below the 2 Jan 2026 high. Direct: −6.5%.
−6.9%
2026
Not yet recovered · 8.9 mo since peak
−10.3%
2019–20 · Covid
Back Dec 2020 · 15.5 mo
−34.5%
2018Old fund
Back Mar 2019 · ~1 yr
−11.9%
2015–16Old fund
Back Jul 2016 · ~1 yr 2 mo
−21.9%
2008Old fund
Back Jul 2010 · ~2 yr 6 mo
−58.9%
Regular Growth, as of 1 Oct 2026. 2026: first hit −10% on 30 Mar, 6.1 months ago.
Why it's down
Why is HDFC Balanced Advantage Fund falling?
Because the big Indian stocks it holds fell, and about 73% of the fund is in shares with no hedge. It has still fallen less than Nifty 50.
Nifty 50 TRI−4.9%
HDFC BAF, Regular Growth−2.0%
ICICI Pru BAF, Regular Growth+2.1%
End-Sep 2025 to end-Sep 2026
01
Its biggest holdings fell
HDFC Bank (4.13% of the fund) is down 24.0% in a year, Reliance (3.74%) 13.9%, Bharti Airtel 6.9%, NTPC 5.1% and ICICI Bank 4.2%. Banks are the biggest sector, at about 19%.
02
A lot of equity for a 'balanced' fund
Shares are 73.3% of the fund (74.6% with REITs), and the Aug 2026 factsheet shows no equity hedges. When large caps fall, most of the fund falls with them.
03
Falls like this are normal for it
The 2026 fall reached −10.3% at its worst, on 30 Mar 2026. In 2019–20 it fell 34.5%. A fund that moves 70–80% as much as Nifty will fall when Nifty does, just by less.
Fund and index changes use month-end values. Holdings as of 31 Aug 2026; stock figures are 1-year price returns.
The payout
The monthly IDCW is not fixed
Changed four times since June 2018, including a 26% cut after Covid. Not guaranteed.
Per unit per month · Jun 2018 – 25 Sep 2026
Jun 2018 – Mar 2020
22 months · ₹6.82 per unit
₹0.31
Apr 2020 – Sep 2021
18 months · ₹4.14 per unit · 26% cut after Covid
₹0.23
Oct 2021 – Mar 2023
18 months · ₹4.68 per unit
₹0.26
Apr 2023 – Nov 2023
8 months · ₹1.84 per unit
₹0.23
Dec 2023 – Sep 2026
34 months · ₹8.50 per unit
₹0.25
Total · 100 months₹25.98
Same for Regular and Direct. Cash investors received.
01
The yield keeps falling
Payout per unit stayed flat while NAV grew. Regular, yearly % of NAV:
2019 13.3%
2020 13.6%
2025 7.75%
2026 so far 6.1%
02
₹0.25 is under 1% of NAV
0.73% of Regular IDCW NAV (₹34.32), 0.61% of Direct (₹40.96). 10-year SIP: 19,690 units × ₹0.25 ≈ ₹4,922 for Sep 2026.
03
Until Mar 2020, tax came out first
About 11.65% DDT was taken from the NAV. NAV fell ~₹0.35; investors got ₹0.31.
04
Before Jun 2018: once a year
The old equity fund paid about 9–12% of NAV annually.
The SWP
Using it for a monthly income (SWP)
An SWP (systematic withdrawal plan) sells a fixed rupee amount of units every month, so you choose the income instead of waiting for HDFC's IDCW. We tested ₹10 lakh in Regular Growth, withdrawing on the 5th of every month from the month after investing.
Value left on 1 Oct 2026 from ₹10 lakh
Started₹6,000/mo₹8,000/mo₹10,000/mo
Jun 2018 99 withdrawals₹16.94L₹13.43L₹9.93L
Oct 2021 59 withdrawals₹13.55L₹12.07L₹10.59L
Oct 2023 35 withdrawals₹10.95L₹10.23L₹9.52L
₹8,000 a month since 2018
₹7.92 lakh taken out and ₹13.43 lakh still left. The low point was ₹6.90 lakh on a withdrawal date, right after the Covid crash.
₹10,000 a month since 2023
₹3.5 lakh taken out, but only ₹9.52 lakh left: below the ₹10 lakh you started with. A 12% withdrawal rate needs a strong market.
Before tax. Direct Growth leaves more (₹14.53 lakh at ₹8,000 a month since June 2018). Up to 15% of units can be sold in the first year without exit load, which covers these withdrawal sizes.
For tax, it counts as an equity-oriented fund, because more than 65% is in Indian shares. Growth units (and SWP withdrawals) are taxed like equity. IDCW payouts are taxed as income.
Capital gains
Growth and SWP
Sold within 1 year
20% on the gain
Sold after 1 year
12.5% on gains above ₹1.25 lakh a year
When
Only when you sell, only on the gain
Your income slab
IDCW
Each payout
Added to your income, taxed at your slab (up to 30% + cess)
TDS
10% once payouts from the scheme cross ₹10,000 in a year
When
Every month, even when the fund falls
Example: the 10-year Regular IDCW SIP in this review received about ₹4,922 in September 2026 alone. In the 30% slab that is about ₹1,536 in tax (31.2% with cess) every month. A Growth investor using an SWP pays tax only on the gain part of each withdrawal, and nothing on the first ₹1.25 lakh of long-term gains each year.
Current rules for resident individuals (Oct 2026). Tax rules change; check your own case with a tax adviser.
10-year ₹5,000 SIP, fees paid over the last 12 months.
Reg Growth
₹14,274
₹1,323 in Sep
Reg IDCW
₹8,314
₹756 in Sep
Dir Growth
₹8,804
₹817 in Sep
Dir IDCW
₹5,365
₹490 in Sep
As of Sep 2026.
The portfolio
What the fund holds
Mostly large caps. Banks are the biggest sector at about 19%. Top 10 = 30.43%.
Large caps53.7%
AAA bonds12.1%
Mid caps11.0%
Govt sec.7.1%
Small caps8.6%
Rest7.5%
Equity is 73.3% of the fund (74.6% with REITs). HDFC's Aug 2026 factsheet shows no equity hedges, only a ₹500 Cr interest rate swap on the bond side.
#HoldingWeight1Y
01ICICI Bank5.32%−4.2%
02HDFC Bank4.13%−24.0%
03Reliance3.74%−13.9%
04SBI3.46%+10.8%
05Bharti Airtel2.93%−6.9%
06Axis Bank2.68%+7.1%
07L&T2.59%+1.7%
087.18% GOI 20331.99%—
09NTPC1.94%−5.1%
10Eternal1.65%+0.9%
Holdings as of 31 Aug 2026.
HDFC vs ICICI
HDFC vs ICICI Prudential Balanced Advantage Fund
The two biggest balanced advantage funds, Regular Growth plans, on the same dates. HDFC earned more since 2018. ICICI fell less, and did better over the last three years.
HDFC BAFICICI Pru BAF
AUM (Aug 2026)₹1,07,296 Cr~₹75,400 Cr*
₹5,000 SIP since Jun 2018₹8,90,325 13.48%₹7,77,769 10.36%
₹1 lakh lumpsum since Jun 2018₹2,74,566 12.88%₹2,26,171 10.28%
SIP, last 3 years (XIRR)1.79%5.20%
1 year−3.16%+1.00%
Biggest fall since Jun 2018−34.5%−27.1%
Worst point of the 2026 fall−10.3%−8.3%
TER, Regular / Direct1.28% / 0.76%1.54% / 1.04%
HDFC returned about 3 points a year more on the SIP since 2018, and costs less. But it fell deeper every time the market fell. ICICI's fund was the smoother ride. Choose by how big a fall you can sit through, not by the brand.
As of 1 Oct 2026. NAVs from AMFI via our NAV database; SIP on the 5th of each month. Direct Growth SIP since Jun 2018: HDFC 14.20%, ICICI 11.04%. TER from AMFI, 31 Aug 2026. *ICICI AUM worked out from its Aug 2026 holdings.
It falls less than Nifty. It still falls, and the payout isn't fixed.
13.48% SIP XIRR in Regular Growth since June 2018, 14.20% in Direct, beta 0.79 vs Nifty 50 TRI. It also fell 34.5% in 2019–20. Direct Growth costs less, and after tax, Growth beats IDCW.
★★★★★3/5· Rated by Kuldeep Singh
Strong long-run returns and lower cost than ICICI, but 73% in shares with no hedge, a 34.5% fall in 2020, a weak last three years, and a monthly payout that isn't fixed.
Good fit if you
✓are investing for 5+ years and can sit through a 30% fall without selling
✓want one fund that mixes shares and debt, and don't want to rebalance yourself
✓are in a high tax slab and want monthly income: pick Direct Growth + SWP, not IDCW
Skip it if you
✕need the money within 3 years (SIP return over the last 3 years: 1.79% a year)
✕expect FD-like safety. “Balanced” here still means about 73% in shares
✕need a fixed monthly income. The IDCW has been changed 4 times since 2018 and can be cut
✕already hold large-cap funds. Its top holdings (ICICI Bank, HDFC Bank, Reliance, Airtel) are probably already in your portfolio
It has done well over the long run: since June 2018, a ₹5,000 SIP returned 13.48% a year in Regular Growth and 14.20% in Direct, ahead of ICICI's balanced advantage fund (10.36%). But it fell 34.5% in 2019–20 and its SIP return over the last three years is only 1.79% a year. It suits 5+ year money that can sit through a 30% fall.
Does HDFC Balanced Advantage Fund give monthly dividends?
+
Yes, the IDCW option pays monthly, but the amount is not fixed. It has changed four times since June 2018: ₹0.31, ₹0.23, ₹0.26, ₹0.23 and now ₹0.25 per unit. Today ₹0.25 is under 1% of the IDCW NAV a month. Payouts are not guaranteed and can be cut.
What is the IDCW dividend history of HDFC Balanced Advantage Fund?
+
₹0.31 per unit a month from Jun 2018 to Mar 2020, ₹0.23 from Apr 2020 to Sep 2021 (a 26% cut after Covid), ₹0.26 from Oct 2021 to Mar 2023, ₹0.23 from Apr to Nov 2023, and ₹0.25 from Dec 2023 to Sep 2026. That is ₹25.98 per unit over 100 months, the same for Regular and Direct.
Should I pick IDCW or Growth?
+
Before tax, which one looks better depends on when you invested: IDCW came out ahead on the SIP since 2018, Growth on the lumpsum. After tax, Growth wins for most people, because IDCW payouts are taxed at your slab every month, while Growth gains are taxed at 12.5% only when you sell, above ₹1.25 lakh a year.
How is HDFC Balanced Advantage Fund taxed?
+
It is taxed as an equity-oriented fund. Growth units sold within a year pay 20% on the gain; after a year, 12.5% on gains above ₹1.25 lakh a year. IDCW payouts are added to your income and taxed at your slab rate, with 10% TDS once payouts from the scheme cross ₹10,000 in a financial year.
Why is HDFC Balanced Advantage Fund falling?
+
Because large Indian stocks fell and about 73% of the fund is in unhedged shares. HDFC Bank, its second-biggest holding, is down 24% in a year and Reliance 13.9%. From end-Sep 2025 to end-Sep 2026 the fund fell 2.0% while Nifty 50 TRI fell 4.9%, so it has still fallen less than the market.
What is the 5-year return of HDFC Balanced Advantage Fund?
+
As of 1 Oct 2026, a ₹1 lakh lumpsum made 12.49% a year over 5 years in Regular Growth and 13.18% in Direct Growth. A ₹5,000 monthly SIP over the same 5 years made 9.42% a year in Regular Growth and 10.11% in Direct, because the last three years were weak.
Is it safe to invest in HDFC Balanced Advantage Fund?
+
It is not safe in the way an FD is. It fell 34.5% in 2019–20 and took 15.5 months to recover, and it was 6.9% below its January 2026 high on 1 Oct 2026. It is less volatile than Nifty 50, and no 3-year or 5-year holding since June 2018 has lost money, but that is a short history.
HDFC or ICICI balanced advantage fund: which is better?
+
Since June 2018, HDFC's fund did better: a ₹5,000 SIP made 13.48% a year against 10.36% for ICICI Prudential's, and HDFC's TER is lower. But ICICI's fund fell less (27.1% vs 34.5% in 2020) and did better over the last three years. HDFC suits investors who can take bigger falls.
Is HDFC Balanced Advantage Fund good for SWP?
+
₹10 lakh in Regular Growth from June 2018 with ₹8,000 a month withdrawn still had ₹13.43 lakh on 1 Oct 2026, after paying out ₹7.92 lakh. Started in October 2023, ₹10,000 a month left only ₹9.52 lakh. An SWP of 6–8% a year has held up; 12% a year only works in strong markets.
Is there a lock-in period or exit load?
+
There is no lock-in. Up to 15% of the units from each purchase can be sold within a year without any charge. Units above that pay a 1% exit load if sold within one year of purchase. After one year there is no exit load, as per the scheme information document.
Why don't these returns match HDFC's "since inception" figure?
+
HDFC uses the Prudence Fund history from 1994. Our NAV series follows the old HDFC Growth Fund, a pure equity fund that became this fund in June 2018 when Prudence was merged into it. Our headline numbers use only the period from June 2018, so they measure the fund you would buy today.
What benchmark is the risk data measured against?
+
Nifty 50 TRI (total return index, with dividends reinvested). The fund's official benchmark is the NIFTY 50 Hybrid Composite Debt 50:50 Index, which we don't have data for, so beta and alpha here compare the fund with the main large-cap stock index instead.
How much more does the Regular plan cost?
+
Regular costs 0.52% a year more in TER (1.28% vs 0.76%, as of 31 Aug 2026). That is the distributor commission. On rolling returns from Jan 2013, Direct has beaten Regular by about 0.7% a year, and on the 10-year ₹5,000 SIP, Direct Growth ended ₹47,086 ahead.
This is a data review, not investment advice. Past returns do not guarantee future returns. Mutual fund investments are subject to market risks; read all scheme-related documents carefully.