How much is ₹1 lakh in 1990 worth today in India?
Based on India's real CPI data (World Bank/IMF), ₹1,00,000 in 1990 is equivalent to approximately ₹10,15,500 today (2025–26). That is over 10× the original amount — cumulative inflation from 1990 to today is around 915%, at an effective average rate of about 6.8% per year. Select the year 1990 in the calculator above to verify this for any amount.
What is ₹1 lakh in 2000 worth today in India?
₹1,00,000 in the year 2000 is worth approximately ₹4,28,900 in 2025–26, based on India's real CPI data. Cumulative inflation from 2000 to today has been around 329%, at an average of 6% per year. To calculate a different amount from the year 2000, enter it in the calculator above and select 2000 from the year picker.
What is a purchasing power calculator?
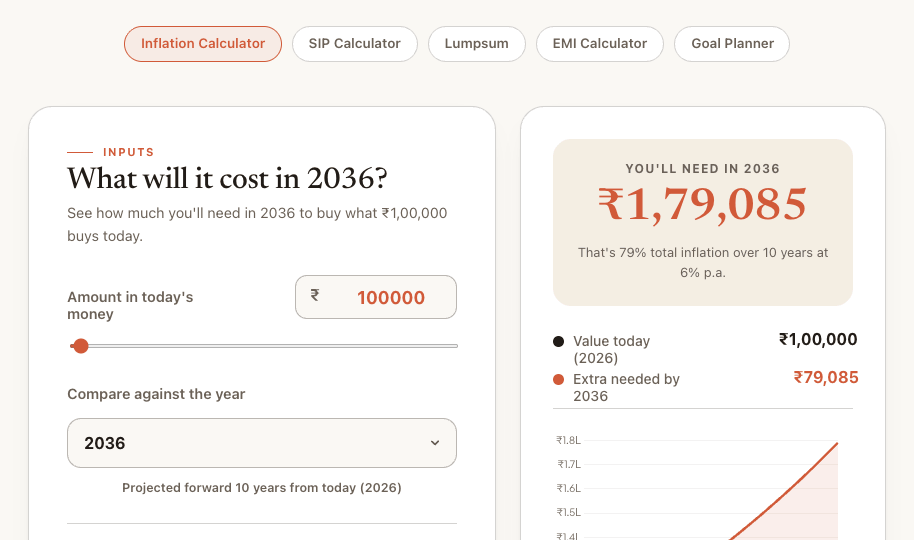
A purchasing power calculator shows how inflation erodes the real value of your money over time. ₹1,00,000 today at 6% annual inflation will only buy what ₹55,839 buys today — after 10 years. Enter your amount and pick a future year above to see this.
What is a reverse inflation calculator?
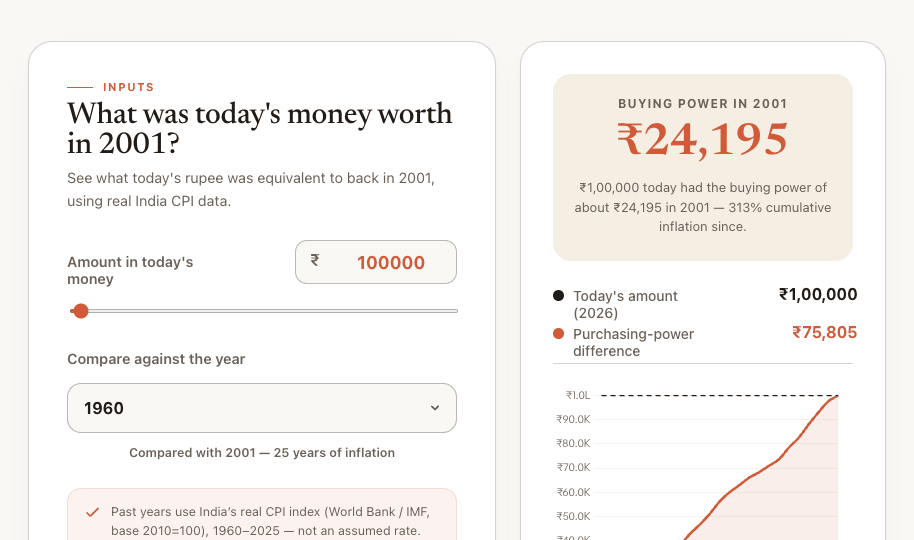
A reverse inflation calculator works backwards — it tells you what a current amount was worth in a past year. ₹1,00,000 in 2025 had the same purchasing power as roughly ₹23,300 in 2000 (at 6% average inflation). Pick a past year in the calculator above to calculate this from real CPI data.
How do I calculate inflation from one year to another?
Enter your amount and pick any year in the calculator above — past or future. The tool automatically computes the number of years from today and shows the full inflation impact. Past years (1960 onward) use India's real CPI data automatically, so you don't need to guess a rate; future years let you set the assumed inflation rate yourself.
How to calculate inflation?
To find future cost: Future Value = Present × (1 + rate)^years. For real purchasing power: Real Value = Nominal ÷ (1 + rate)^years. At 6% inflation for 10 years, ₹1,00,000 costs ₹1,79,085 in future, but only has ₹55,839 of today's purchasing power if left uninvested.
What is the average inflation rate in India?
India's Consumer Price Index (CPI) inflation has averaged 6–7% per year over the long term. In the 1990s it was closer to 9%, from 2000–2010 around 6%, 2010–2020 around 6.5%, and 2020–2025 around 5.5%. For long-term planning, using 6% is a conservative and widely-used estimate for Indian investors.
How much has inflation increased since 2020?
India's CPI inflation averaged approximately 6.2% per year from 2020 to 2025. This means ₹1,00,000 in 2020 now requires roughly ₹1,35,000 in 2025 to buy the same goods — a cumulative rise of ~35% in just 5 years. Try it yourself: pick 2020 (or any past year) in the calculator above to see the real CPI-based impact.
What is the inflation rate formula?
The inflation rate formula is: Inflation Rate (%) = [(CPI Current − CPI Previous) ÷ CPI Previous] × 100. Example: CPI rose from 150 to 159 — inflation = [(159 − 150) ÷ 150] × 100 = 6%. To find the impact on your money over multiple years: Future Cost = Present Value × (1 + rate)^years.
How to calculate the inflation rate?
To calculate the inflation rate between two periods: (1) Get CPI values for both years from RBI or MOSPI. (2) Apply: [(New CPI − Old CPI) ÷ Old CPI] × 100. Example: CPI was 100 in 2010 and 190 in 2020 → cumulative inflation = 90%, or about 6.6% per year. Pick any past year in the calculator above to instantly compute this from real CPI data.
What is the current inflation rate in India?
India's CPI inflation in early 2025 is approximately 4.5–5%, down from a high of 7.4% in 2023. The RBI targets 4% with a ±2% tolerance band (2–6%). For the most current figure, check the RBI website or MOSPI. For long-term planning, 6% remains the standard estimate used by Indian financial planners.
How to protect money from inflation?
To protect money from inflation in India: (1) Invest in equity mutual funds or index funds — historically 12–14% annual returns, well above 6% inflation. (2) Consider RBI Floating Rate Bonds or inflation-indexed instruments. (3) Avoid leaving large sums in savings accounts earning 3–3.5%. Enter your amount and pick a future year in the calculator above to see exactly how much uninvested savings lose every year.
How does inflation affect savings?
Inflation silently erodes savings. ₹50,000 in a savings account earning 3.5% interest against 6% inflation loses real value every year. After 10 years, that ₹50,000 has the purchasing power of only ₹27,919. Enter ₹50,000 and pick a future year above (with a 6% assumed rate) to see the year-by-year erosion on your own savings.
What is a good inflation rate?
A good inflation rate is generally 2–4% in developed economies. For India, the RBI's target is 4% with a tolerance band of 2–6%. Inflation in this range signals a healthy, growing economy. Below 2% risks deflation; above 6% starts significantly eroding purchasing power for Indian households.
Is 7% inflation high?
Yes, 7% inflation is considered high in India — it exceeds the RBI's upper tolerance limit of 6%. At 7% inflation, ₹1,00,000 loses nearly half its purchasing power in just 10 years (real value drops to ₹50,835). The RBI typically raises interest rates when inflation crosses 6% to bring it back under control. Enter 7% in the calculator above to visualise this.