Checking market…

ETF iNAV Tracker India

Check live iNAV of all NSE ETFs and see which are trading at a discount or premium to fair value — free, no login needed.

Covers Nippon India ETF Gold BeES (GOLDBEES), Nifty BeES (NIFTYBEES), Bank BeES (BANKBEES), Junior BeES (JUNIORBEES), Nippon India Silver ETF (SILVERBEES), ICICI Prudential Nifty 50 ETF (NIFTYIETF), SBI ETF Nifty 50 (SETFNIF50), HDFC Nifty 50 ETF (HDFCNIFTY), Nifty IT (ITBEES), PSU Bank BeES (PSUBNKBEES) and 190+ more NSE-listed ETFs in one sortable table.

Data: NSE via proxy
200+ ETFs, sortable & searchable
Auto-refreshes every 60 seconds
Total ETFs
At Premium
At Discount
Last Updated
ℹ️ iNAV is estimated from live data: NSE index for Nifty ETFs · USD/INR movement for US ETFs · Hang Seng for HK ETFs · Sensex for BSE ETFs. Gold/Silver ETFs show prev NAV (LBMA-based pricing can't be reliably estimated). Updates every minute.
Popular:
Symbol ETF Name Mkt Price iNAV vs iNAV Day Change Volume
Guide

How to check iNAV of an ETF online in India

1

Open this ETF iNAV Tracker

This tool loads live iNAV data from NSE automatically for all 200+ ETFs. No login, no broker account needed — works from any browser.

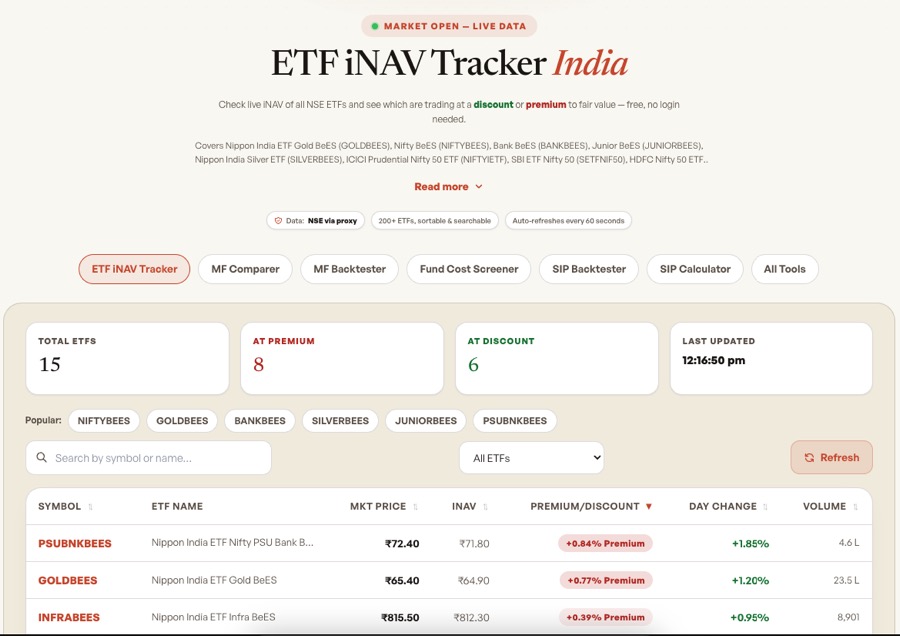
ETF iNAV Tracker tool showing live iNAV and market price table for all NSE ETFs
The ETF iNAV Tracker loads automatically — live iNAV for 200+ ETFs, no account needed
2

Search for your ETF

Type the ETF symbol or full name — e.g. GOLDBEES, NIFTYBEES, BANKBEES, JUNIORBEES, SILVERBEES, NIFTYIETF, SETFNIF50, HDFCNIFTY, ITBEES, PSUBNKBEES. Results filter instantly.

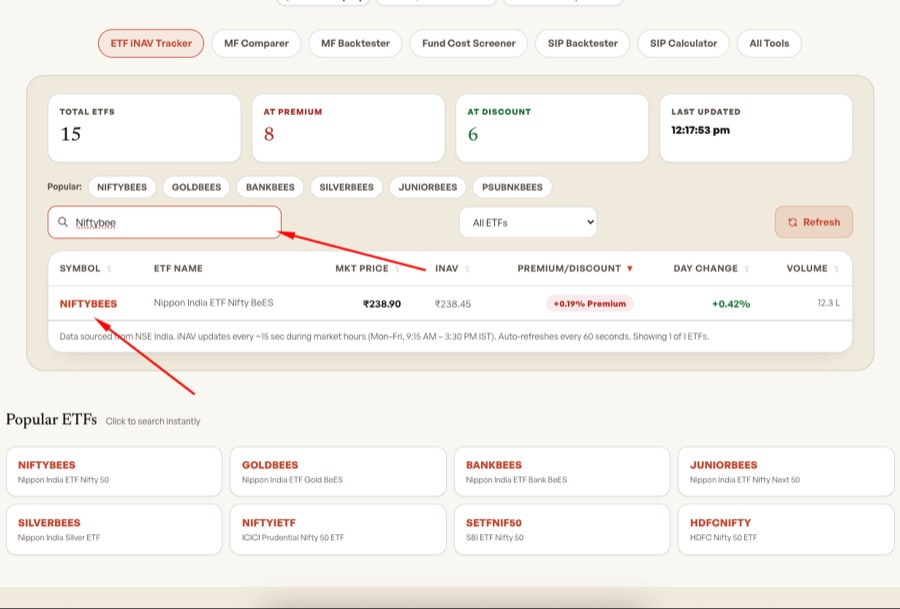
Search bar in ETF iNAV Tracker with annotation arrows highlighting where to type the ETF symbol
Type any ETF symbol or name in the search box — results filter instantly as you type
3

Read the iNAV and market price

The iNAV column shows the real-time indicative fair value, updated every ~15 seconds during market hours (Mon–Fri, 9:15 AM – 3:30 PM IST).

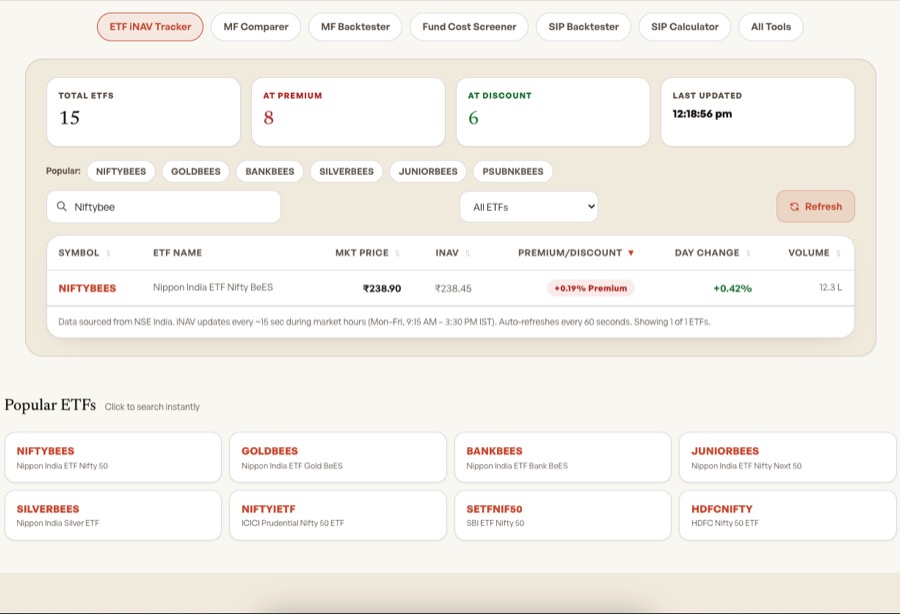
ETF iNAV Tracker search result showing NIFTYBEES iNAV, market price, and premium/discount percentage
iNAV and market price appear side-by-side — live data refreshes every ~15 seconds
4

Check the Premium/Discount badge

Green = Discount — ETF is cheaper than fair value, generally a good entry. Red = Premium — ETF costs more than fair value, consider waiting. A gap within ±0.1% is normal for liquid ETFs like Nifty BeES. iNAV data is sourced from NSE India's official ETF data; portfolio holdings are from AMFI monthly disclosures.

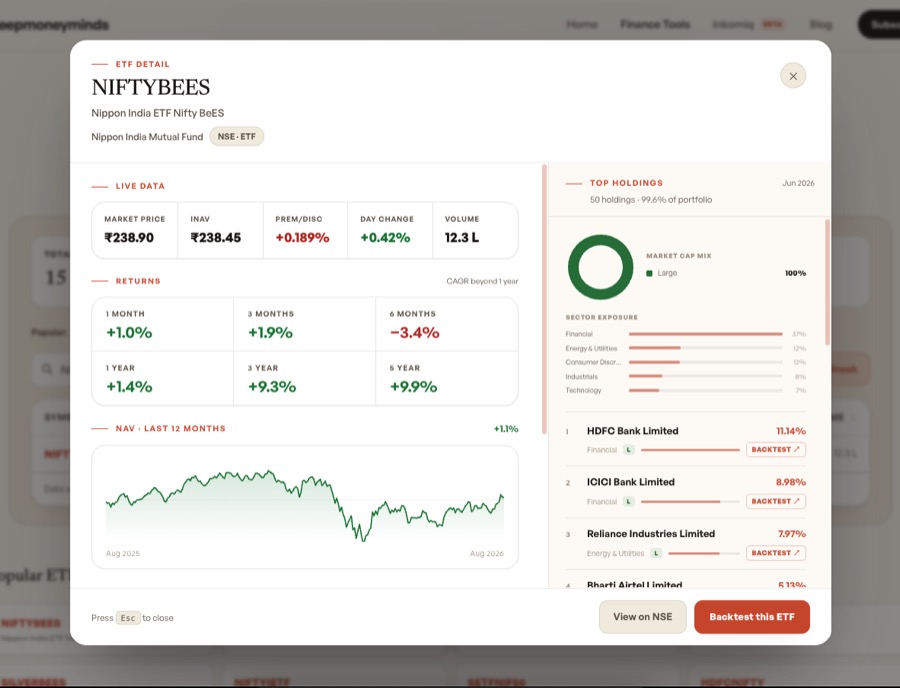
ETF detail modal showing NIFTYBEES returns, NAV chart, and top holdings with market cap and sector breakdown
Click any ETF row to open the detail modal — returns history, NAV chart, and full holdings breakdown
Explained

iNAV & premium/discount

What is iNAV of an ETF?

iNAV (Indicative Net Asset Value) is the real-time estimated fair value of an ETF, computed every 15 seconds from the live prices of all its underlying holdings. It is what the ETF should be worth right now.

NAV vs iNAV — what's the difference?

NAV is the official end-of-day value calculated after market close. iNAV is the live intra-day estimate. When buying an ETF during market hours, always compare to iNAV — not yesterday's NAV.

ETF at Premium

Market price > iNAV. You are paying more than the fair value of the underlying basket. Common in low-liquidity ETFs. For active ETFs like Nifty BeES, premiums above 0.5% are rare and short-lived.

ETF at Discount

Market price < iNAV. You buy the basket for less than its fair value — generally a favorable entry. A persistent large discount (>1%) can signal very low liquidity in that ETF.

Methodology

How we estimate iNAV

NSE stopped publishing live iNAV in its bulk API. We reconstruct it from live market data using the formula below — one method per ETF type.

📈

Nifty index ETFs — 200+ ETFs (Nifty 50, Bank Nifty, Nifty IT, Midcap 150…)

Est. iNAV = Prev NAV × (1 + Live Index % ÷ 100)

We fetch all Nifty index live % changes from NSE allIndices API every 30 seconds and apply it to the previous day's NAV. Both the index and the ETF's prev NAV are anchored to yesterday's close, so the % change is directly applicable. Covers ~203 ETFs tracking Nifty 50, Nifty Bank, Nifty IT, Midcap 150, Smallcap 250, and all other Nifty sub-indices.

🥇

Gold & Silver ETFs — GOLDBEES, SILVERBEES, HDFCGOLD…

Shows Prev NAV — no intraday estimate

Indian gold and silver ETFs are priced against the LBMA daily spot fixing price (London), converted to INR and adjusted for Indian import duties. COMEX futures (the only free real-time source) can diverge from LBMA spot by 2–3% intraday, making any estimate unreliable. We show the previous day's NAV as-is, which is the accurate reference for these ETFs.

🇺🇸

US index ETFs — MAFANG (FANG+), MON100 (Nasdaq 100), MONQ50…

Est. iNAV = Prev NAV × (1 + USD/INR% ÷ 100)

US markets are closed during Indian trading hours (9:15 AM–3:30 PM IST = 3:45–9:30 AM ET). So the underlying index price is unchanged from yesterday's close — only the USD/INR exchange rate moves the iNAV. We use live USD/INR spot from Yahoo Finance (USDINR=X). Note: this means US ETF iNAV estimates are approximate during Indian hours.

🇭🇰

Hang Seng ETFs — HNGSNGBEES, MAHKTECH

Est. iNAV = Prev NAV × (1 + HSI_INR% ÷ 100)
where HSI_INR% = (1 + ^HSI%) × (1 + USD/INR%) − 1

Hong Kong market overlaps with Indian hours (9:15 AM–12:00 PM IST), so the Hang Seng Index (^HSI) is live during Indian trading. HKD is pegged near 7.8 to the USD, so we combine ^HSI % with USD/INR % (same as gold). MAHKTECH (Hang Seng Tech) also uses ^HSI as an approximation since ^HSTECH is unavailable on Yahoo Finance.

📊

BSE Sensex ETFs — SENSEXETF, BSLSENETFG, ESENSEX…

Est. iNAV = Prev NAV × (1 + Sensex% ÷ 100)

These ETFs are listed on NSE but track the BSE Sensex index. Since Sensex is a pure INR index, no currency adjustment is needed — we just apply the live BSE Sensex % change (^BSESN from Yahoo Finance) directly to the prev NAV.

🏦

Debt & Liquid ETFs — LIQUIDBEES, G-SEC ETFs, target maturity…

Shows Prev NAV — no intraday estimate

Debt ETFs hold bonds, G-Secs, or money market instruments — there is no live index tracking them intraday. For these ETFs, the iNAV barely changes tick-to-tick anyway (daily accrual, not market-driven). We show the previous day's NAV as-is, which is the accurate reference for pricing purposes.

FAQ

Frequently asked questions

How to check iNAV of ETF India online without Zerodha or SBI?

You do not need a broker account to check ETF iNAV. This Deep Money Minds ETF iNAV Tracker fetches live data directly from NSE and shows iNAV, market price, and premium/discount for all ETFs in one place — free and without any login.

How to check NIFTYBEES, GOLDBEES, or BANKBEES iNAV live?

Use the search box above. Type "NIFTYBEES" to see Nippon India ETF Nifty BeES iNAV, market price, and current premium/discount in real time. Same for "GOLDBEES" (Nippon India ETF Gold BeES) and "BANKBEES" (Nippon India ETF Bank BeES). All three are among the most liquid ETFs on NSE and typically trade within ±0.05% of their iNAV. iNAV data is sourced directly from NSE and updates every 15 seconds during market hours (Mon–Fri, 9:15 AM – 3:30 PM IST).

How is ETF iNAV calculated?

iNAV is calculated by summing the current market prices of all the ETF's holdings, weighted by their allocation, and dividing by the total units outstanding. NSE computes and publishes this every 15 seconds during market hours. For a Nifty 50 ETF, all 50 stock prices are used; for a Gold ETF, the live domestic gold price is used.

How to find iNAV of Gold ETF in India?

Search "gold" in the ETF iNAV Tracker above. All Gold ETFs — Nippon India ETF Gold BeES (GOLDBEES), HDFC Gold ETF (HDFCMFGETF), SBI Gold ETF (SETFGOLD), Axis Gold ETF — will appear with their live iNAV and whether they are at a premium or discount to the current gold price. Nippon India ETF Gold BeES (GOLDBEES) is the most liquid and most searched Gold ETF for iNAV data.

How to check iNAV of Tata Silver ETF / Silver ETF India?

Search "silver" in the tracker above. Nippon India Silver ETF (SILVERBEES) and Tata Silver ETF track domestic silver prices. Silver ETFs tend to have wider premium/discount ranges than Nifty or Gold ETFs due to lower trading volumes — making it especially important to check iNAV before placing a buy order.

Which ETFs in India have the lowest premium to iNAV?

High-volume ETFs consistently trade closest to their iNAV. The tightest typically include: Nippon India ETF Nifty BeES (NIFTYBEES), Nippon India ETF Gold BeES (GOLDBEES), Nippon India ETF Bank BeES (BANKBEES), Nippon India ETF Nifty Next 50 Junior BeES (JUNIORBEES), ICICI Prudential Nifty 50 ETF (NIFTYIETF), SBI ETF Nifty 50 (SETFNIF50), and HDFC Nifty 50 ETF (HDFCNIFTY). Sort this tracker by the Premium/Discount column to see live rankings right now.

Is it good to buy ETF at a discount?

Generally yes — buying at a discount means you get the underlying basket of assets for less than their market value, which is a small but real advantage. However, if an ETF consistently trades at a large discount, it may signal liquidity issues. Stick to ETFs with high average daily volumes for tighter spreads.

Why does ETF iNAV data only update during market hours?

iNAV is a live calculation based on the real-time prices of the underlying securities. Since NSE trading happens between 9:15 AM and 3:30 PM IST on weekdays, iNAV is only published during this window. Outside market hours, the last available iNAV from the previous session is shown.

Can I use this as an ETF screener for India?

Yes. You can filter by premium-only, discount-only, or high premium/discount (>0.5%), sort by symbol, price, volume, or day change, and search by name or symbol. It gives you a live snapshot of the entire NSE ETF universe — making it a basic but powerful ETF screener for Indian investors.

What is an acceptable premium or discount for an ETF in India?

A premium or discount within ±0.1% is excellent — typical for the most liquid ETFs like Nippon India ETF Nifty BeES (NIFTYBEES) or Nippon India ETF Gold BeES (GOLDBEES). Up to ±0.5% is acceptable. Between 0.5% and 1% warrants caution. Anything beyond 1% is a red flag indicating very low liquidity. ET Money and NSE both suggest less than 1% as the safe upper limit for retail ETF execution.

How do I check if an ETF is trading at a premium or discount?

Three steps: (1) Note the ETF's current market price on NSE. (2) Find its iNAV — published by NSE every 15 seconds during market hours. (3) If market price > iNAV, the ETF is at a premium; if market price < iNAV, it is at a discount. The easiest way is to use the tracker above — it shows the premium/discount % for all 200+ NSE ETFs at once with color-coded badges.

How do I check ETF liquidity in India?

Check three things: (1) Average Daily Volume — higher volume = tighter spreads. (2) AUM — larger AUM means more active market makers. (3) Premium/discount to iNAV — a gap under 0.1% is the clearest sign of good liquidity. The Volume column in this tracker shows live trading data. Sort by Volume to instantly rank all NSE ETFs by liquidity. Nippon India ETF Nifty BeES (NIFTYBEES), Nippon India ETF Gold BeES (GOLDBEES), and Nippon India ETF Bank BeES (BANKBEES) consistently top the list.

What is the 7% rule in ETF investing?

The 7% rule (from investor William O'Neil) is a stop-loss discipline: exit any position that falls 7–8% below your purchase price to avoid larger losses. Applied to ETFs in India, it means setting a personal exit threshold before you buy. Since ETFs track a diversified index and cannot go to zero like individual stocks, many Indian investors use a 10–15% rule instead. The principle is the same: decide your maximum tolerable loss before placing the order, not after.

How to check iNAV of ETF in Zerodha Kite?

Zerodha Kite shows the live market price of an ETF but does not display iNAV directly. To compare an ETF's market price against its iNAV in Zerodha, you would need to separately look up iNAV on NSE's website. This ETF iNAV Tracker is the faster alternative — it pulls live iNAV from NSE and places it side by side with the market price for all 200+ ETFs at once, making it easy to spot whether you are paying a fair price before placing an order in Kite.

Why does an ETF trade at a premium or discount to iNAV?

ETFs can temporarily trade at a premium or discount due to supply-demand imbalances on the exchange. If more investors want to buy than sell at a given moment, the market price rises above iNAV (premium). If more want to sell, it falls below iNAV (discount). Authorised Participants (APs) — large institutional players — can create or redeem ETF units to bring the price back in line with iNAV, but this arbitrage takes time. During high volatility or thin trading, the gap can widen significantly, which is why checking iNAV before any ETF buy order matters.
Kuldeep Singh — creator of Deep Money Minds

Built by

Kuldeep Singh

Personal Finance Writer & Developer

Finance content creator focused on radical transparency in Indian personal finance. I build tools that use real data so Indian investors can make genuinely informed decisions. This ETF iNAV Tracker pulls live data directly from NSE — because the only honest way to know if you're overpaying for an ETF is to compare its price to its fair value in real time.

More about me